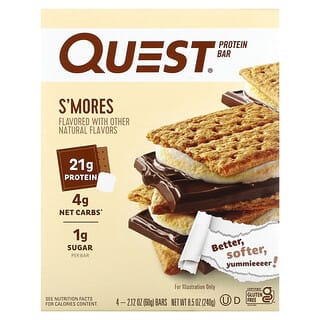
Protein Bar, S'Mores
S'mores · Whey Protein Isolate, Milk Protein Isolate · 60g serving
4.0(1 rating)XRay Summary
- Ranks #11 of 433 · XRay Score 89/100
- Strength: Protein Efficiency (Top 4%)
- Protein Source: Milk Blend
- Flavor: Chocolate And Sweet
- Dietary: Kosher Certified And Gluten-Free
Protein Bar, S'Mores by Quest Nutrition lands in the upper tier in the protein bar category with an XRay Score of 89/100, placing #11 out of 433. Its strongest dimension is protein efficiency (top 4%), offering excellent protein-to-calorie efficiency. The protein comes from a milk protein blend, combining the benefits of both whey and casein. Flavor-wise, it features chocolate and sweet notes. This product also is Kosher certified and gluten-free.
How It Ranks
Ranked against 433 products in this category.
Leaderboard
XRay Score — Protein Bar (433 products)
Performance
Visual comparison across the 5 dimensions and macronutrient split.
Radar
How this product compares on each dimension — overlaid on the category median (gray). Larger area is always better. Hover any label for raw values and formula.
Macro Split
Nutrition
Macronutrient breakdown and product details.
| Nutrient | Per Serving (60g) | Per 100g |
|---|---|---|
| Energy | 180kcal | 300kcal |
| Protein | 21g | 35g |
| Total Fat | 7g | 11.67g |
| Sat. Fat | 2.5g | 4.17g |
| Carbohydrates | 23g | 38.33g |
| Fiber | 13g | 21.67g |
| Sugar | 1g | 1.67g |
| Sodium | 220mg | 366.67mg |
Shop
Best prices across retailers — shown in your selected currency.
Featured In
Articles that analyse or compare this product.
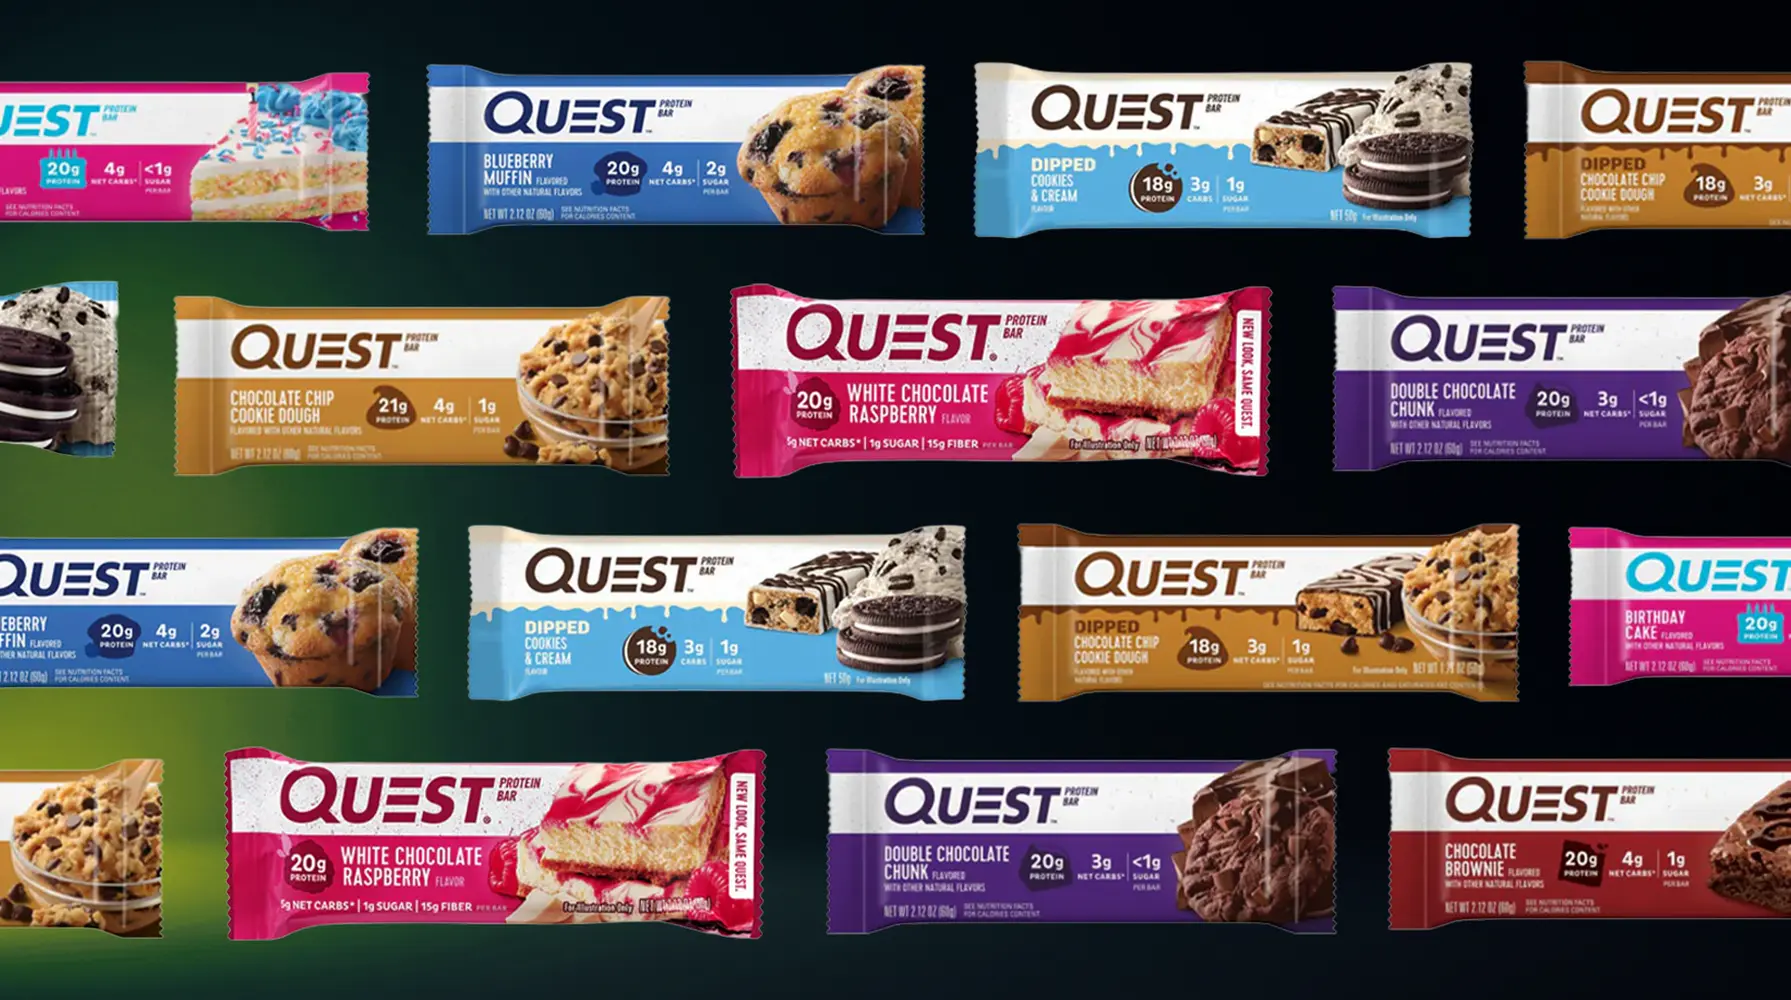
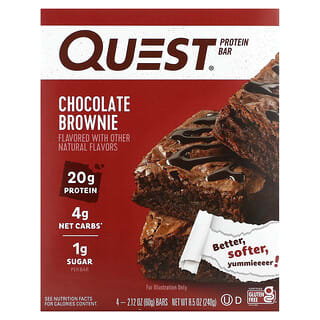
Best Quest Bar: All Flavors Ranked by Nutrition
Quest makes more than 30 different protein bars across many sub-lines — but the classic 15-flavor range dominates, with many of them landing in the top 20 of over 400 bars. We ranked every one to find which flavor gives you the best macros.
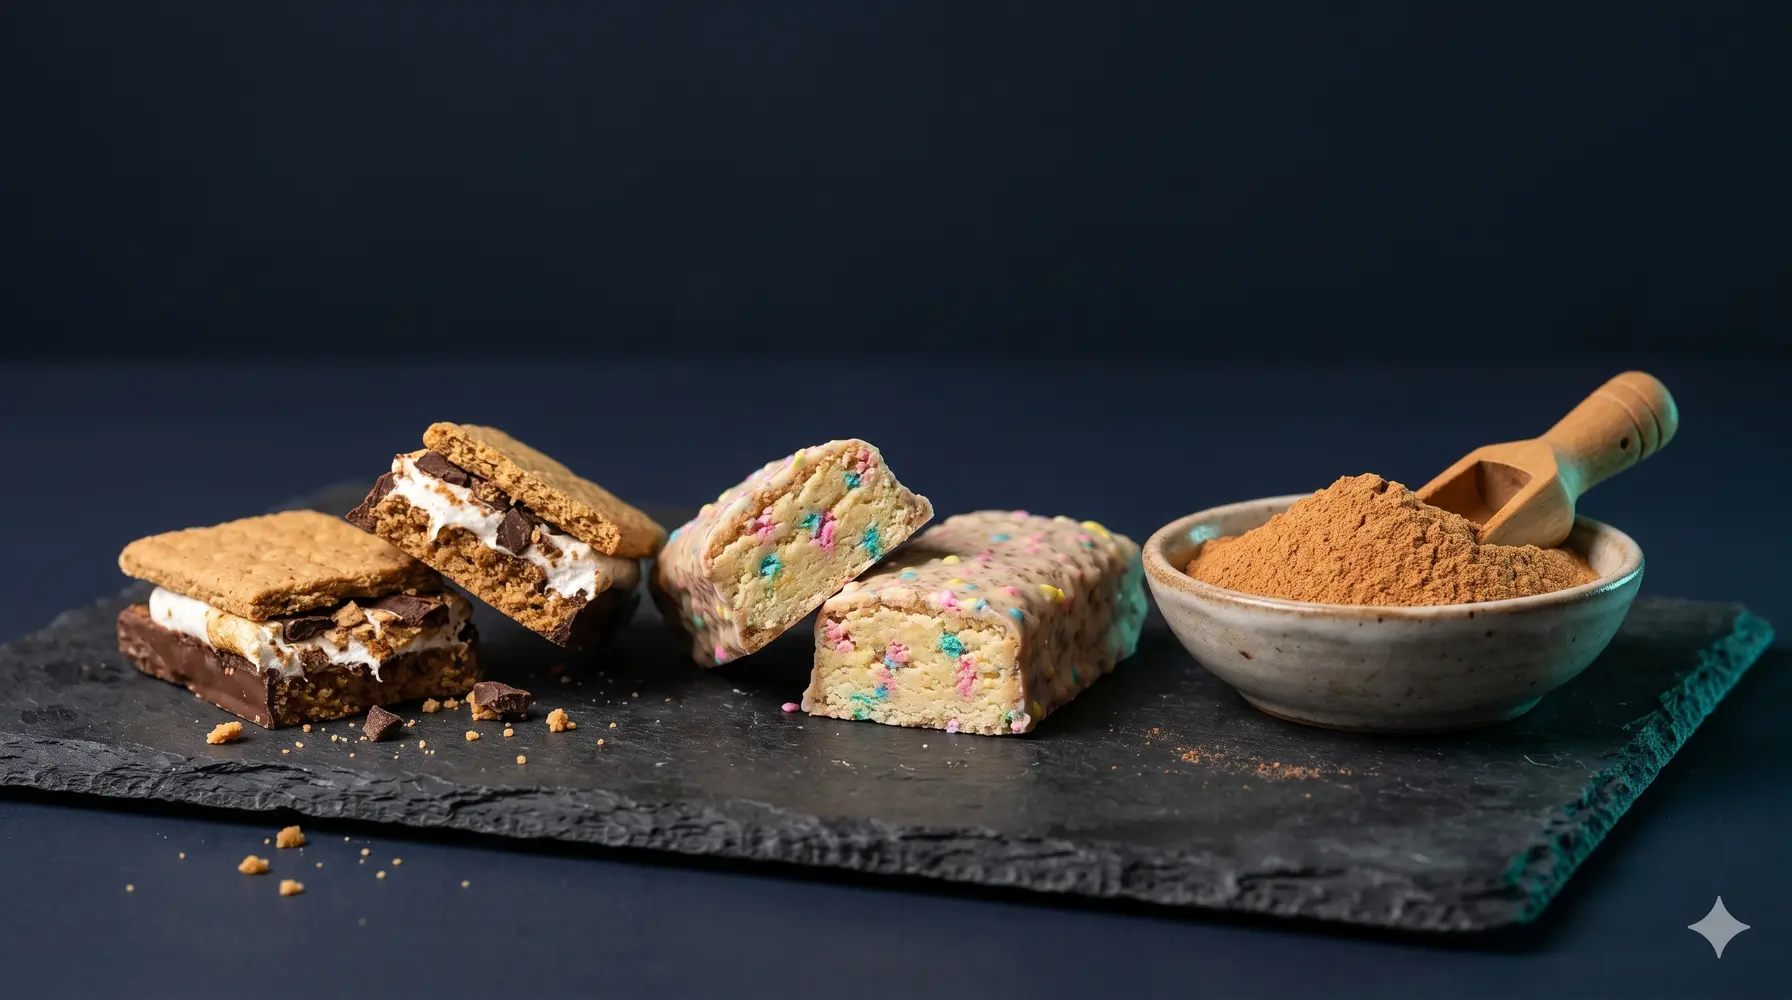
Best Nostalgic Protein Flavors: S'Mores, Birthday Cake, Cookie Dough and More
Not all nostalgic protein flavors are gimmicks — some rank among the best products we've ever scored. We break down which comfort-food flavors actually deliver on macros, from s'mores to horchata.
Why Fiber Matters on a High Protein Diet (and Which Products Actually Have It)
Most protein products contain almost no fiber — and high-protein diets need more of it, not less. We dug into our catalogue to find the products that solve both problems at once.
Chips That Beat Bars: Why Protein Crisps Are the Most Underrated Snack
Protein crisps pack nearly double the protein per 100 g of most protein bars — and score higher on MacroXray's rankings. Here's why they deserve a spot in your rotation.
The Flavor Tax: How Your Flavor Choice Secretly Changes Your Macros
Same brand, same product line, same tub size — different flavor, different macros, different score. Picking Mocha Cappuccino over Delicious Strawberry can quietly cost you 32 extra calories per 100 g and drop your ranking by 23 points.
Disclaimer — All nutritional data and product information is provided to the best of our knowledge based on publicly available sources and may contain inaccuracies. MacroXray is not responsible for discrepancies between listed and actual product data. Nothing on this site constitutes medical, dietary, or nutritional advice. Always consult a qualified healthcare professional before making changes to your diet. Dietary restriction labels (e.g. gluten-free, vegan) are based on ingredient information and may not account for cross-contamination or manufacturing processes — always verify with the manufacturer if you have allergies or intolerances. Halal, Kosher and other certifications shown are based on product labeling or third party site descriptions; actual certification status may vary by region and should be confirmed with the certifying body or manufacturer. Prices shown are sourced from third-party retailers at the time of last scan and may have changed since then. MacroXray is not a retailer and does not sell products directly.