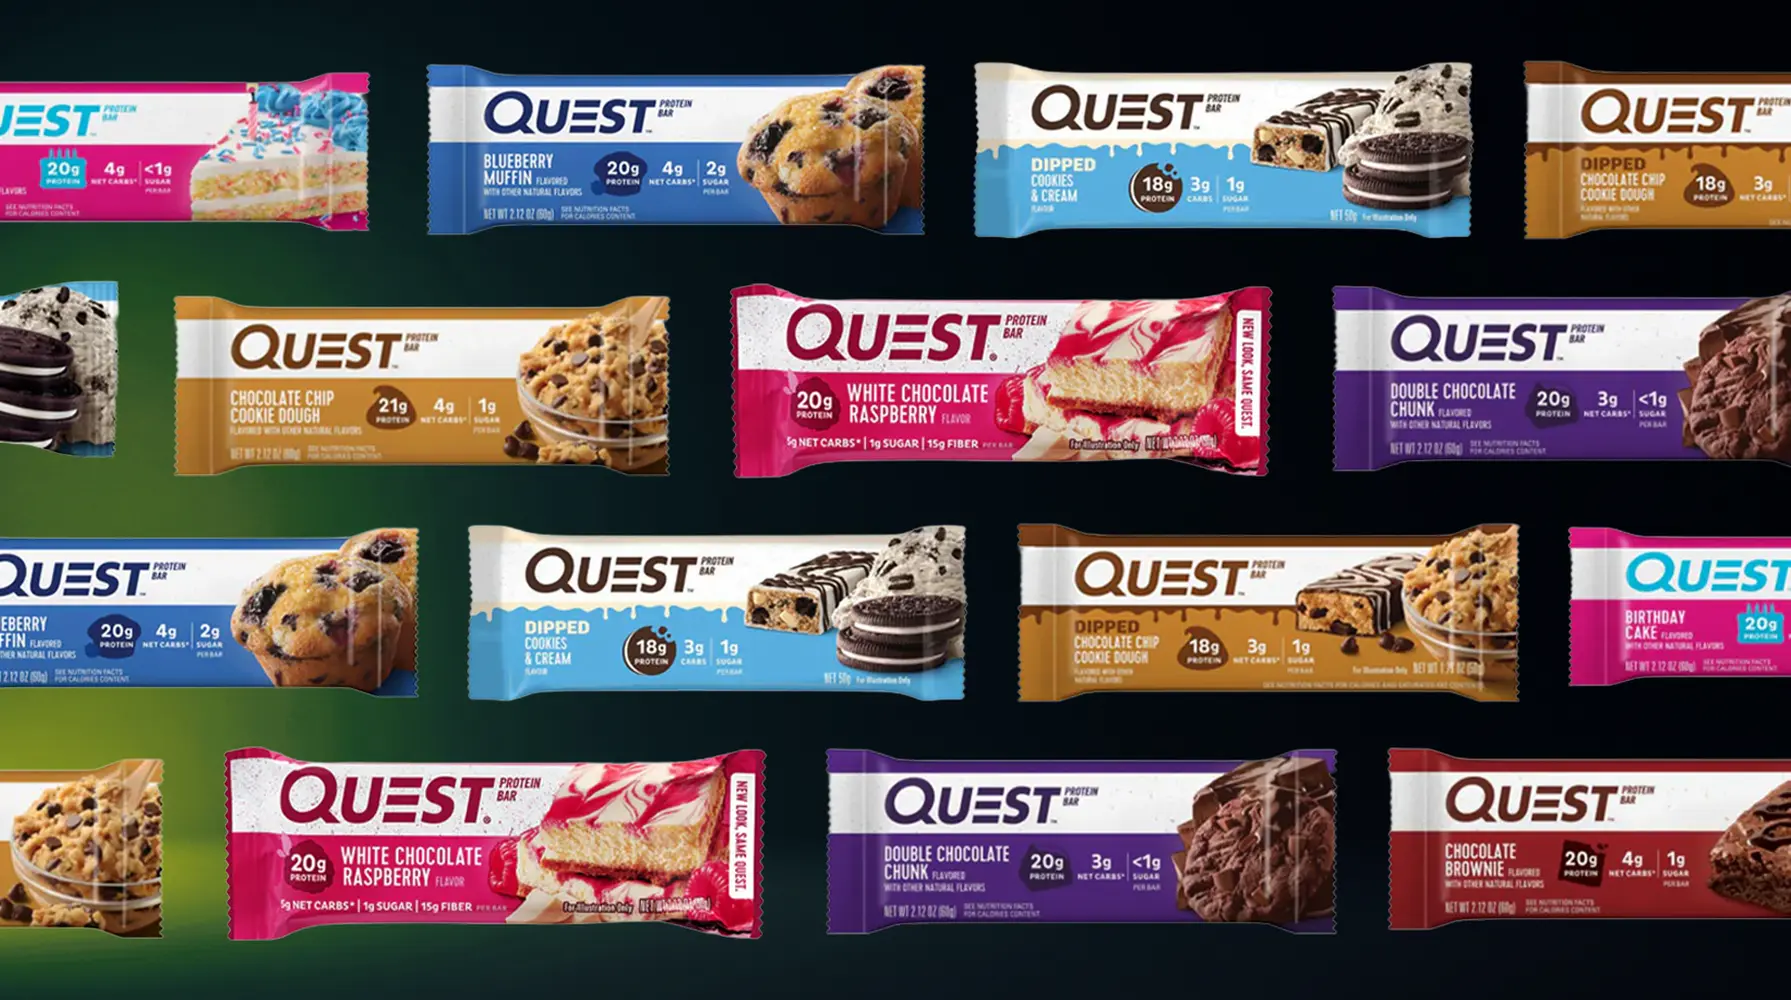
Quest is one of the best-selling protein bar brands in the world. The pitch is familiar: 20–21 g protein, high fiber, low sugar, gluten-free. But Quest doesn't make one bar — we have seven distinct product lines totalling 29 bars in our database. The classic Quest Protein Bar alone comes in 15 flavors, and the differences between them are bigger than most people realize.
We ranked every Quest bar against over 400 protein bars in our catalogue. The classic line is genuinely elite — 13 of its 15 flavors land in the top 20 of 414 bars. But once you step outside the classic range into the Overload, Hero, and Candy Bar lines, scores drop fast. Your choice of sub-line matters more than your choice of flavor.
MacroXray may earn a commission on some links in this article at no extra cost to you. Full disclosure.
The classic lineup: all 15 flavors ranked
We score every product using our XRay Score — a composite 0–100 rating that weighs protein efficiency, value for money, leanness, low carbs, and fiber. Here are all 15 classic Quest Protein Bar flavors ranked by it. The spread from top to bottom is 16 points — from Apple Pie at 91.7 down to Strawberry Shortcake at 75.1 — enough to shift a flavor from rank #3 to rank #58 out of 414 bars.
| # | Product | XRay | P/100 kcal | kcal / 100 g | Fat / 100 g | Buy |
|---|---|---|---|---|---|---|
1 | 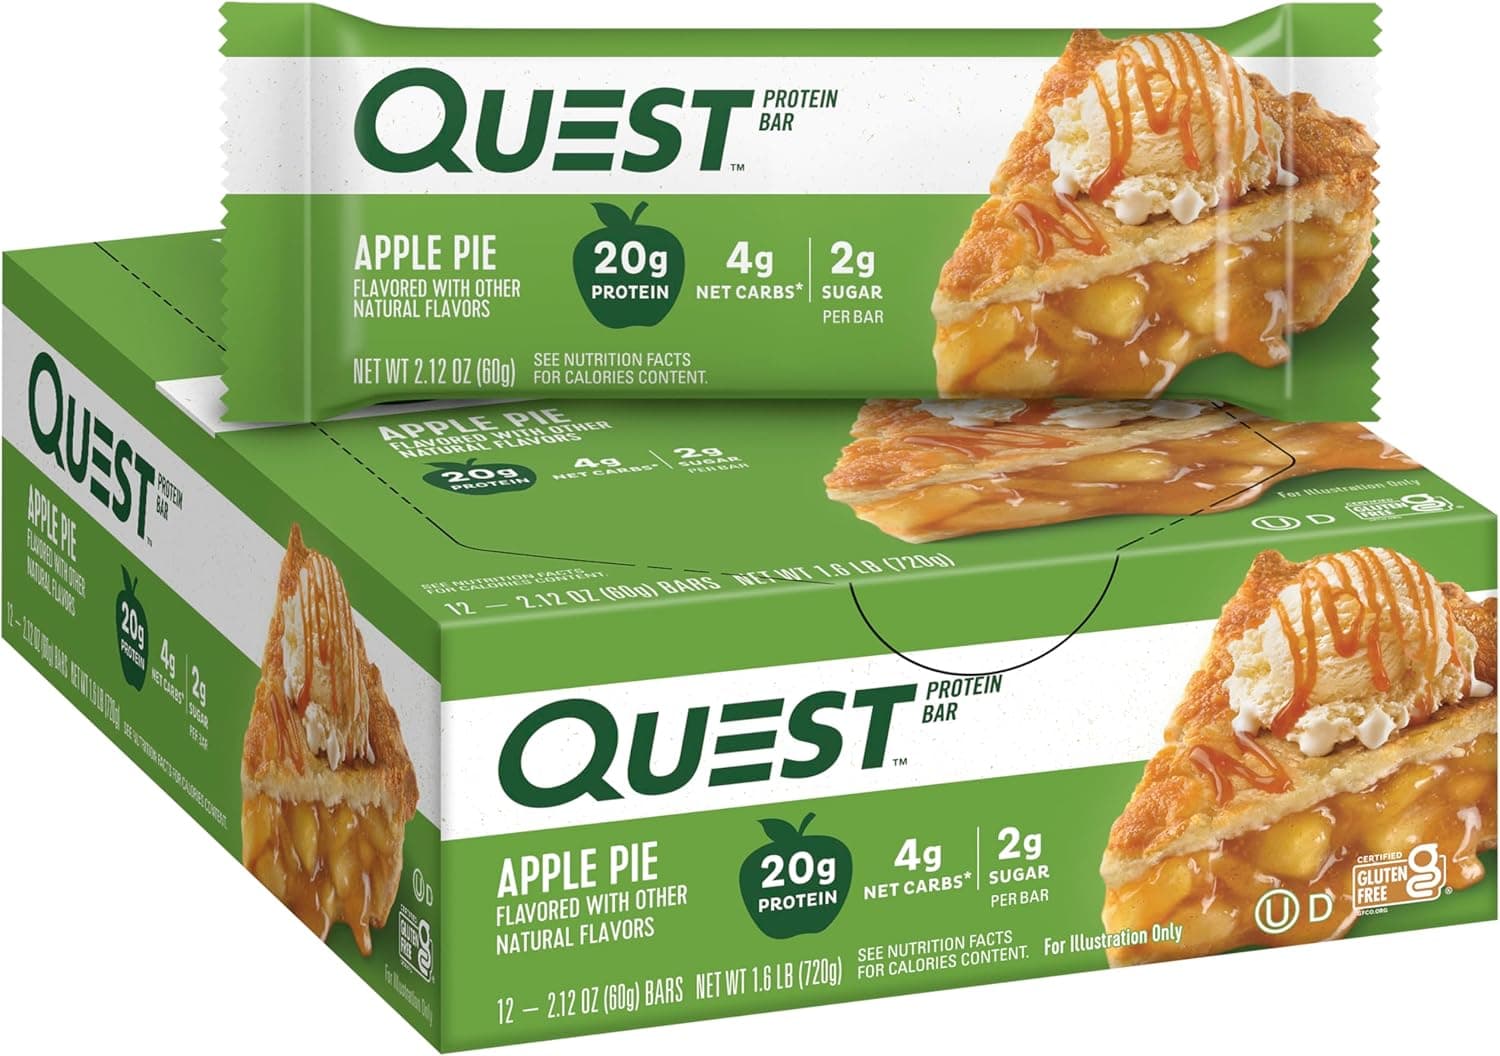 Quest Nutrition Quest Protein Bar (Apple Pie) | 91 | 11.8g | 283.3 | 10.0g | Buy |
2 | 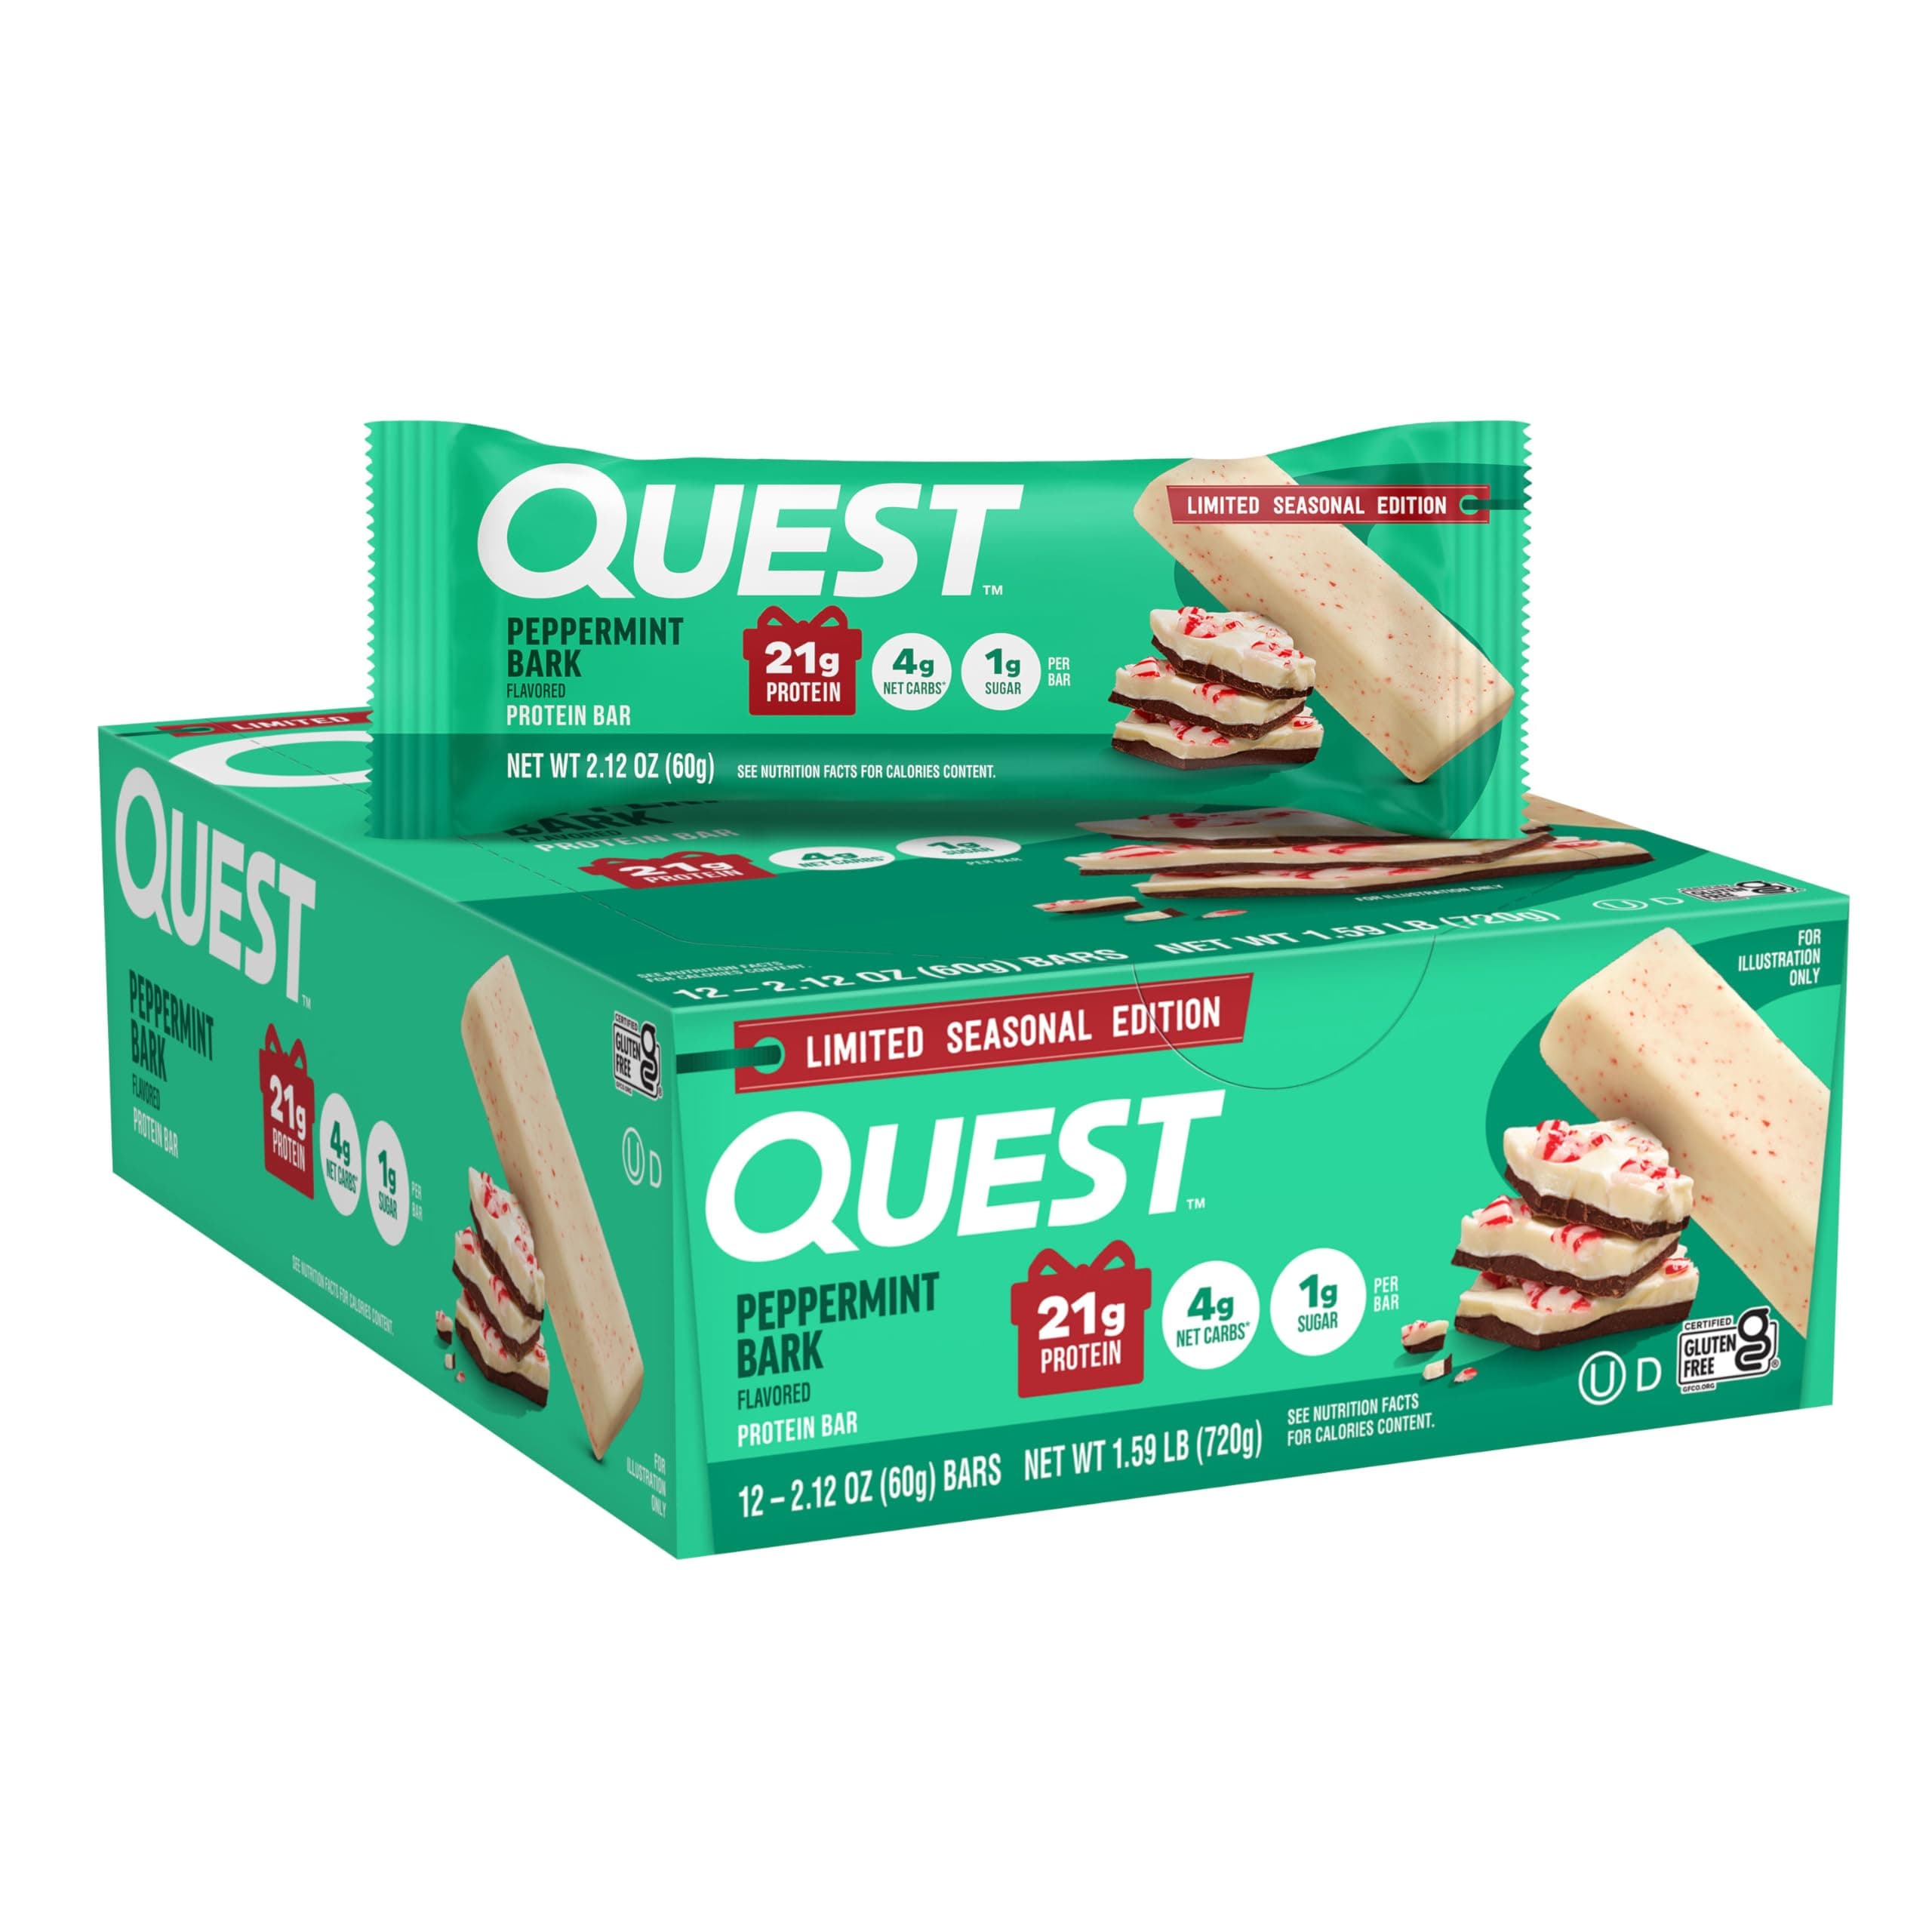 Quest Nutrition Quest Protein Bar (Peppermint Bark) | 90 | 11.7g | 300.0 | 11.7g | |
3 |  Quest Nutrition Protein Bar, S'Mores | 89 | 11.7g | 300.0 | 11.7g | Buy |
4 |  Quest Nutrition Protein Bar, Chocolate Brownie | 89 | 11.8g | 283.3 | 10.0g | Buy |
5 | 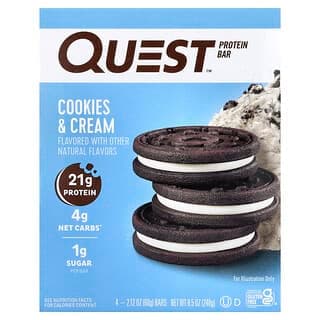 Quest Nutrition Protein Bar, Cookies & Cream | 86 | 11.1g | 316.7 | 13.3g | Buy |
6 | 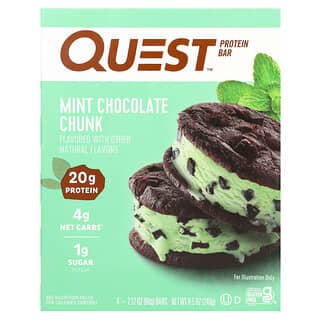 Quest Nutrition Protein Bar, Mint Chocolate Chunk | 86 | 11.1g | 300.0 | 11.7g | Buy |
7 | 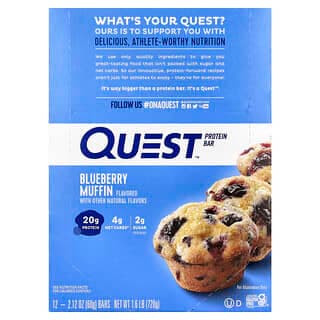 Quest Nutrition Protein Bar, Blueberry Muffin | 85 | 11.1g | 300.0 | 11.7g | Buy |
8 | 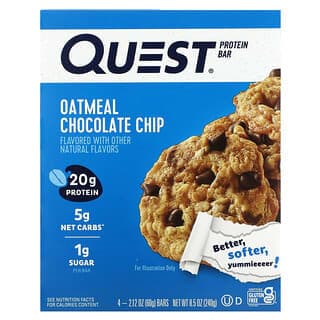 Quest Nutrition Protein Bar, Oatmeal Chocolate Chip | 85 | 11.1g | 300.0 | 11.7g | Buy |
9 | 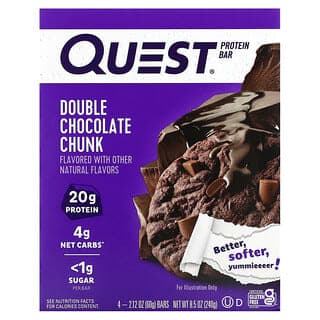 Quest Nutrition Protein Bar, Double Chocolate Chunk | 84 | 11.8g | 283.3 | 11.7g | Buy |
10 | 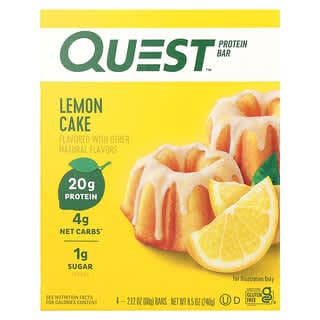 Quest Nutrition Protein Bar, Lemon Cake | 84 | 11.1g | 300.0 | 11.7g | Buy |
11 | 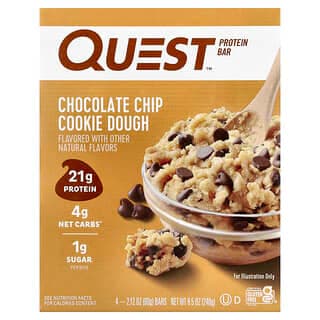 Quest Nutrition Protein Bar, Chocolate Chip Cookie Dough | 84 | 11.1g | 316.7 | 15.0g | Buy |
12 | 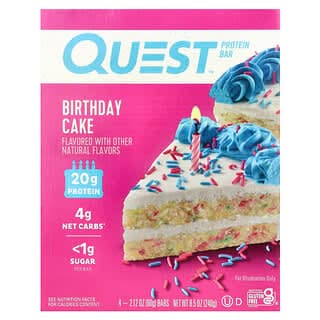 Quest Nutrition Protein Bar, Birthday Cake | 83 | 11.1g | 300.0 | 11.7g | Buy |
13 | 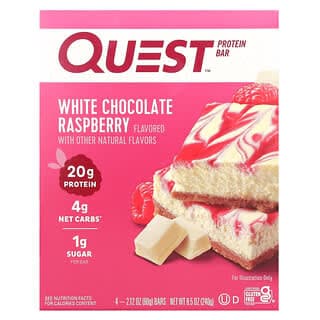 Quest Nutrition Protein Bar, White Chocolate Raspberry | 82 | 10.5g | 316.7 | 13.3g | Buy |
14 | 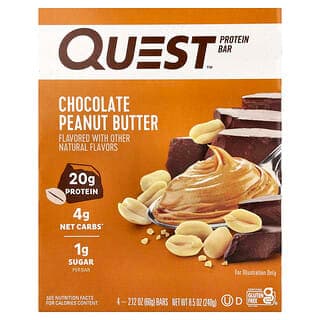 Quest Nutrition Protein Bar, Chocolate Peanut Butter | 78 | 10.5g | 316.7 | 15.0g | Buy |
15 | 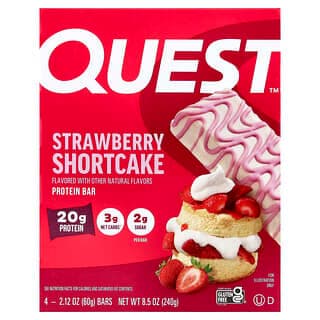 Quest Nutrition Protein Bar, Strawberry Shortcake | 74 | 10.0g | 333.3 | 16.7g | Buy |
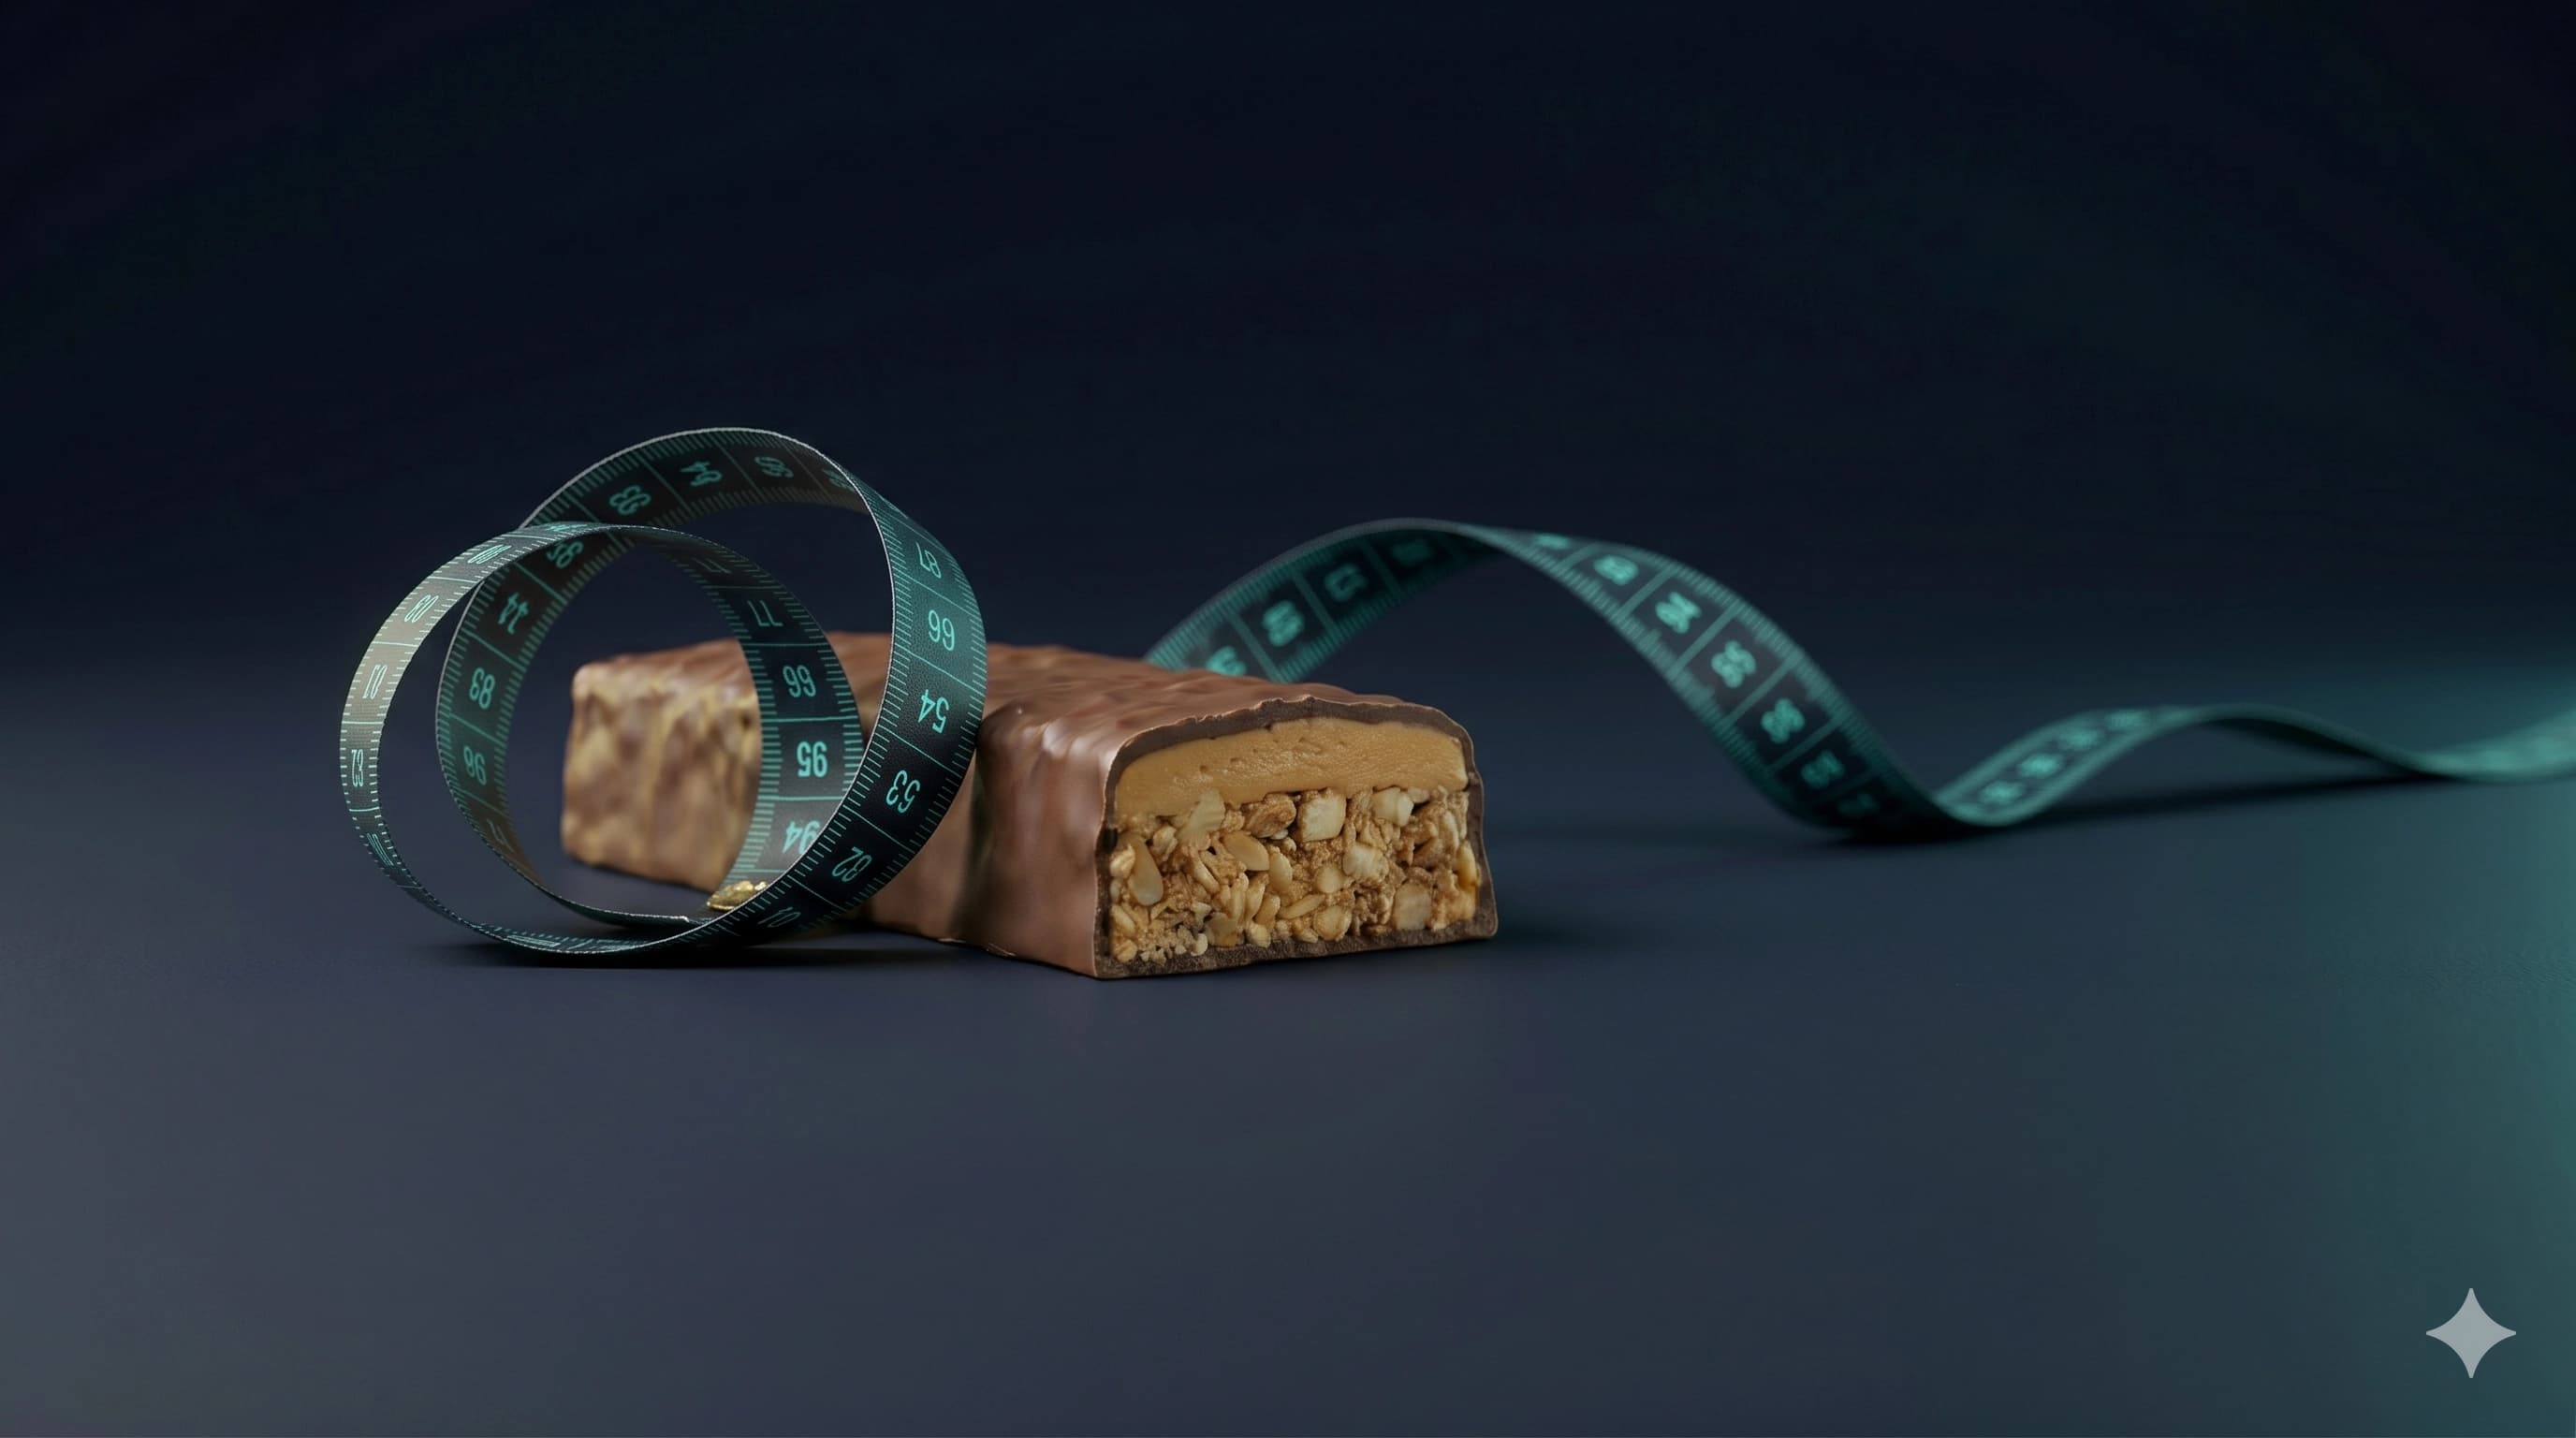
Every classic flavor uses the same protein source — a milk protein blend — and comes in the same 60 g bar. Like the Pure Protein range, the differences come from the coatings, fillings, and flavor systems that shift fat, carbs, and calories from one bar to the next. But unlike Pure Protein, Quest's standout advantage is fiber — every classic flavor packs 16–25 g of fiber per 100 g (10–15 g per bar), compared to Pure Protein's typical 0–2 g.
Why Apple Pie wins
Apple Pie takes the #1 spot in the Quest lineup — and #3 out of all 414 bars in the database — because it combines low calories with high fiber and doesn't give up protein to get there. At 283 kcal per 100 g, it ties with Chocolate Brownie and Double Chocolate Chunk for the fewest calories in the classic range. It carries just 10 g fat per 100 g (6 g per bar), tying with Chocolate Brownie as the leanest. And its fiber sits at 21.67 g per 100 g (13 g per bar), which lands it in the 91st percentile among all bars.
Only two flavors beat Apple Pie on fiber: Chocolate Brownie (25 g) and Mint Chocolate Chunk (23.33 g). The only flavors that match it on calories are Chocolate Brownie and Double Chocolate Chunk. Apple Pie doesn't lead any single dimension outright, but it has no weakness — and that consistency is what pushes its XRay Score to 91.7.
The top-ranked Quest flavor — #3 out of 414 bars in our database.
The fiber advantage
Fiber is where Quest separates from the pack. While most protein bar brands treat fiber as an afterthought — Pure Protein averages 0–2 g per 100 g, for instance — Quest builds every classic bar around a high-fiber base. The results are striking.
| # | Product | Fiber / 100 g | XRay | Carbs / 100 g | kcal / 100 g | Buy |
|---|---|---|---|---|---|---|
1 | Quest Nutrition Protein Bar, Chocolate Brownie | 25.0g | 89 | 13.3g | 283.3 | Buy |
2 | Quest Nutrition Protein Bar, Mint Chocolate Chunk | 23.3g | 86 | 16.7g | 300.0 | Buy |
3 | Quest Nutrition Protein Bar, S'Mores | 21.7g | 89 | 16.7g | 300.0 | Buy |
4 | Quest Nutrition Quest Protein Bar (Apple Pie) | 21.7g | 91 | 18.3g | 283.3 | Buy |
5 | Quest Nutrition Protein Bar, Blueberry Muffin | 21.7g | 85 | 16.7g | 300.0 | Buy |
6 | Quest Nutrition Protein Bar, Oatmeal Chocolate Chip | 21.7g | 85 | 16.7g | 300.0 | Buy |
7 | Quest Nutrition Protein Bar, Cookies & Cream | 21.7g | 86 | 15.0g | 316.7 | Buy |
8 | Quest Nutrition Protein Bar, Lemon Cake | 21.7g | 84 | 18.3g | 300.0 | Buy |
9 | Quest Nutrition Quest Protein Bar (Peppermint Bark) | 20.0g | 90 | 16.7g | 300.0 | |
10 | Quest Nutrition Protein Bar, Double Chocolate Chunk | 20.0g | 84 | 20.0g | 283.3 | Buy |
11 | Quest Nutrition Protein Bar, Birthday Cake | 20.0g | 83 | 21.7g | 300.0 | Buy |
12 | Quest Nutrition Protein Bar, Chocolate Chip Cookie Dough | 20.0g | 84 | 16.7g | 316.7 | Buy |
13 | Quest Nutrition Protein Bar, White Chocolate Raspberry | 21.7g | 82 | 15.0g | 316.7 | Buy |
14 | Quest Nutrition Protein Bar, Chocolate Peanut Butter | 18.3g | 78 | 18.3g | 316.7 | Buy |
15 | Quest Nutrition Protein Bar, Strawberry Shortcake | 16.7g | 74 | 18.3g | 333.3 | Buy |
Chocolate Brownie is the fiber king at 25 g per 100 g — that's 15 g per bar, which lands it in the 97th percentile for fiber among all 414 bars. Mint Chocolate Chunk follows at 23.33 g. Even the lowest-fiber classic flavor, Strawberry Shortcake, carries 16.67 g per 100 g (10 g per bar) — far more than most competitors' best offering. If you're tracking fiber alongside protein, the classic Quest line makes it almost impossible to choose badly.
Leanness and calories
Fat content across the classic range runs from 10 g to 16.67 g per 100 g (6–10 g per bar). The leanest flavors — Apple Pie and Chocolate Brownie at 10 g fat — also happen to be the lowest-calorie at 283 kcal per 100 g. At the other end, Strawberry Shortcake carries 16.67 g fat and 333 kcal per 100 g — a 67% fat increase over the leanest options.
The peanut butter and cookie dough flavors sit in the middle at 15 g fat per 100 g. Chocolate Peanut Butter is the only classic flavor that drops out of the top 20 alongside Strawberry Shortcake — the extra fat pulls its rank down to #38.
The sugar story
Here's where Quest genuinely stands out: most classic flavors carry just 1–3 g sugar per 100 g (1–2 g per bar). Double Chocolate Chunk reports 0 g sugar — the lowest in the entire lineup. The sweetness in Quest bars comes primarily from erythritol and sucralose rather than added sugars, which keeps the sugar line remarkably flat across the range.
Compare that to Pure Protein, where sugar ranges from 2–8 g per 100 g, or to many mainstream bars that carry 15–20 g. Quest bars are effectively sugar-free across the board, regardless of flavor.
Beyond the classic line
Quest sells six additional bar sub-lines: Overload, Hero Crispy, Crispy, Dipped, Minis, and the Candy Bar. Most don't come close to the classic range — and in some cases, the gap is dramatic.
| # | Product | XRay | P/100 kcal | Fat / 100 g | Fiber / 100 g | Buy | |
|---|---|---|---|---|---|---|---|
1 | Quest Nutrition Quest Protein Bar (Apple Pie) | 91 | 11.8g | 10.0g | 21.7g | Buy | |
2 | 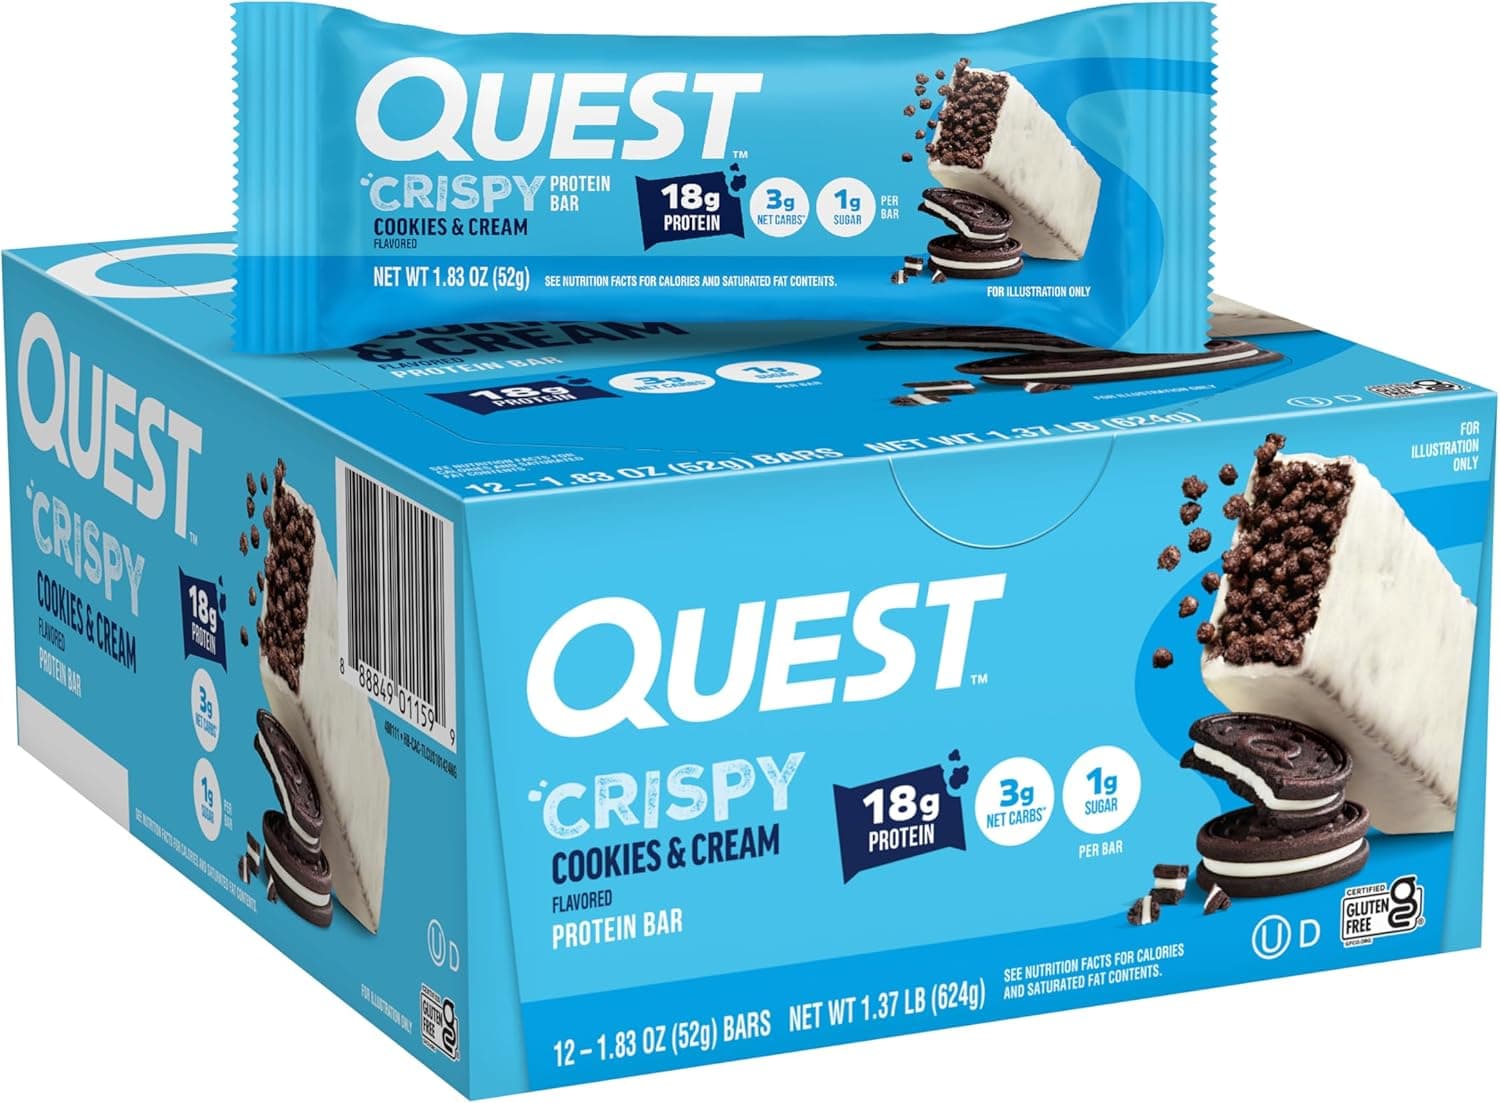 Quest Nutrition Quest Crispy Hero Protein Bar (Cookies & Cream) | 79 | 12.0g | 11.5g | 11.5g | Buy | |
3 | 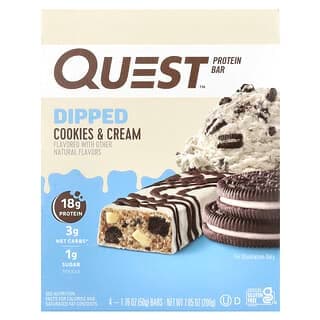 Quest Nutrition Protein Bar, Dipped, Cookies & Cream | 70 | 10.0g | 18.0g | 16.0g | Buy | |
4 | 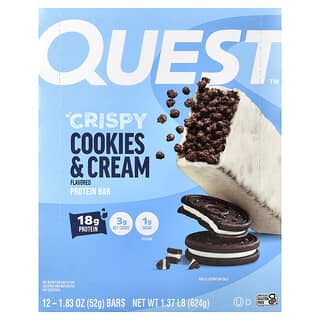 Quest Nutrition Quest Crispy Cookies & Cream Protein Bar | 70 | 12.0g | 11.5g | 11.5g | Buy | |
5 | 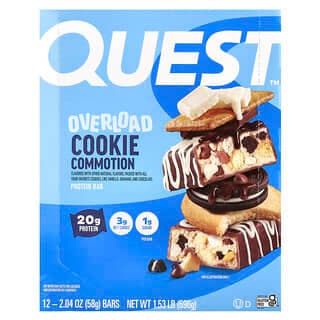 Quest Nutrition Overload Protein Bar, Cookie Commotion | 66 | 10.0g | 15.5g | 19.0g | Buy | |
6 | 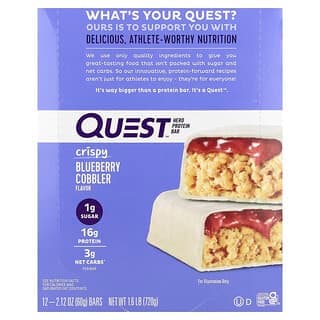 Quest Nutrition Hero Protein Bar, Crispy Blueberry Cobbler | 61 | 10.0g | 11.7g | 16.7g | Buy | |
7 | 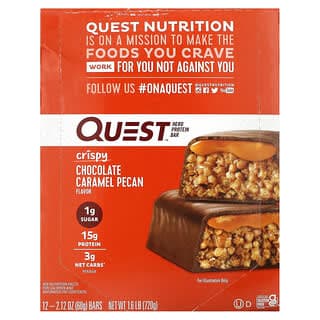 Quest Nutrition Hero Protein Bar, Crispy Chocolate Caramel Pecan | 51 | 8.8g | 15.0g | 18.3g | Buy | |
8 | 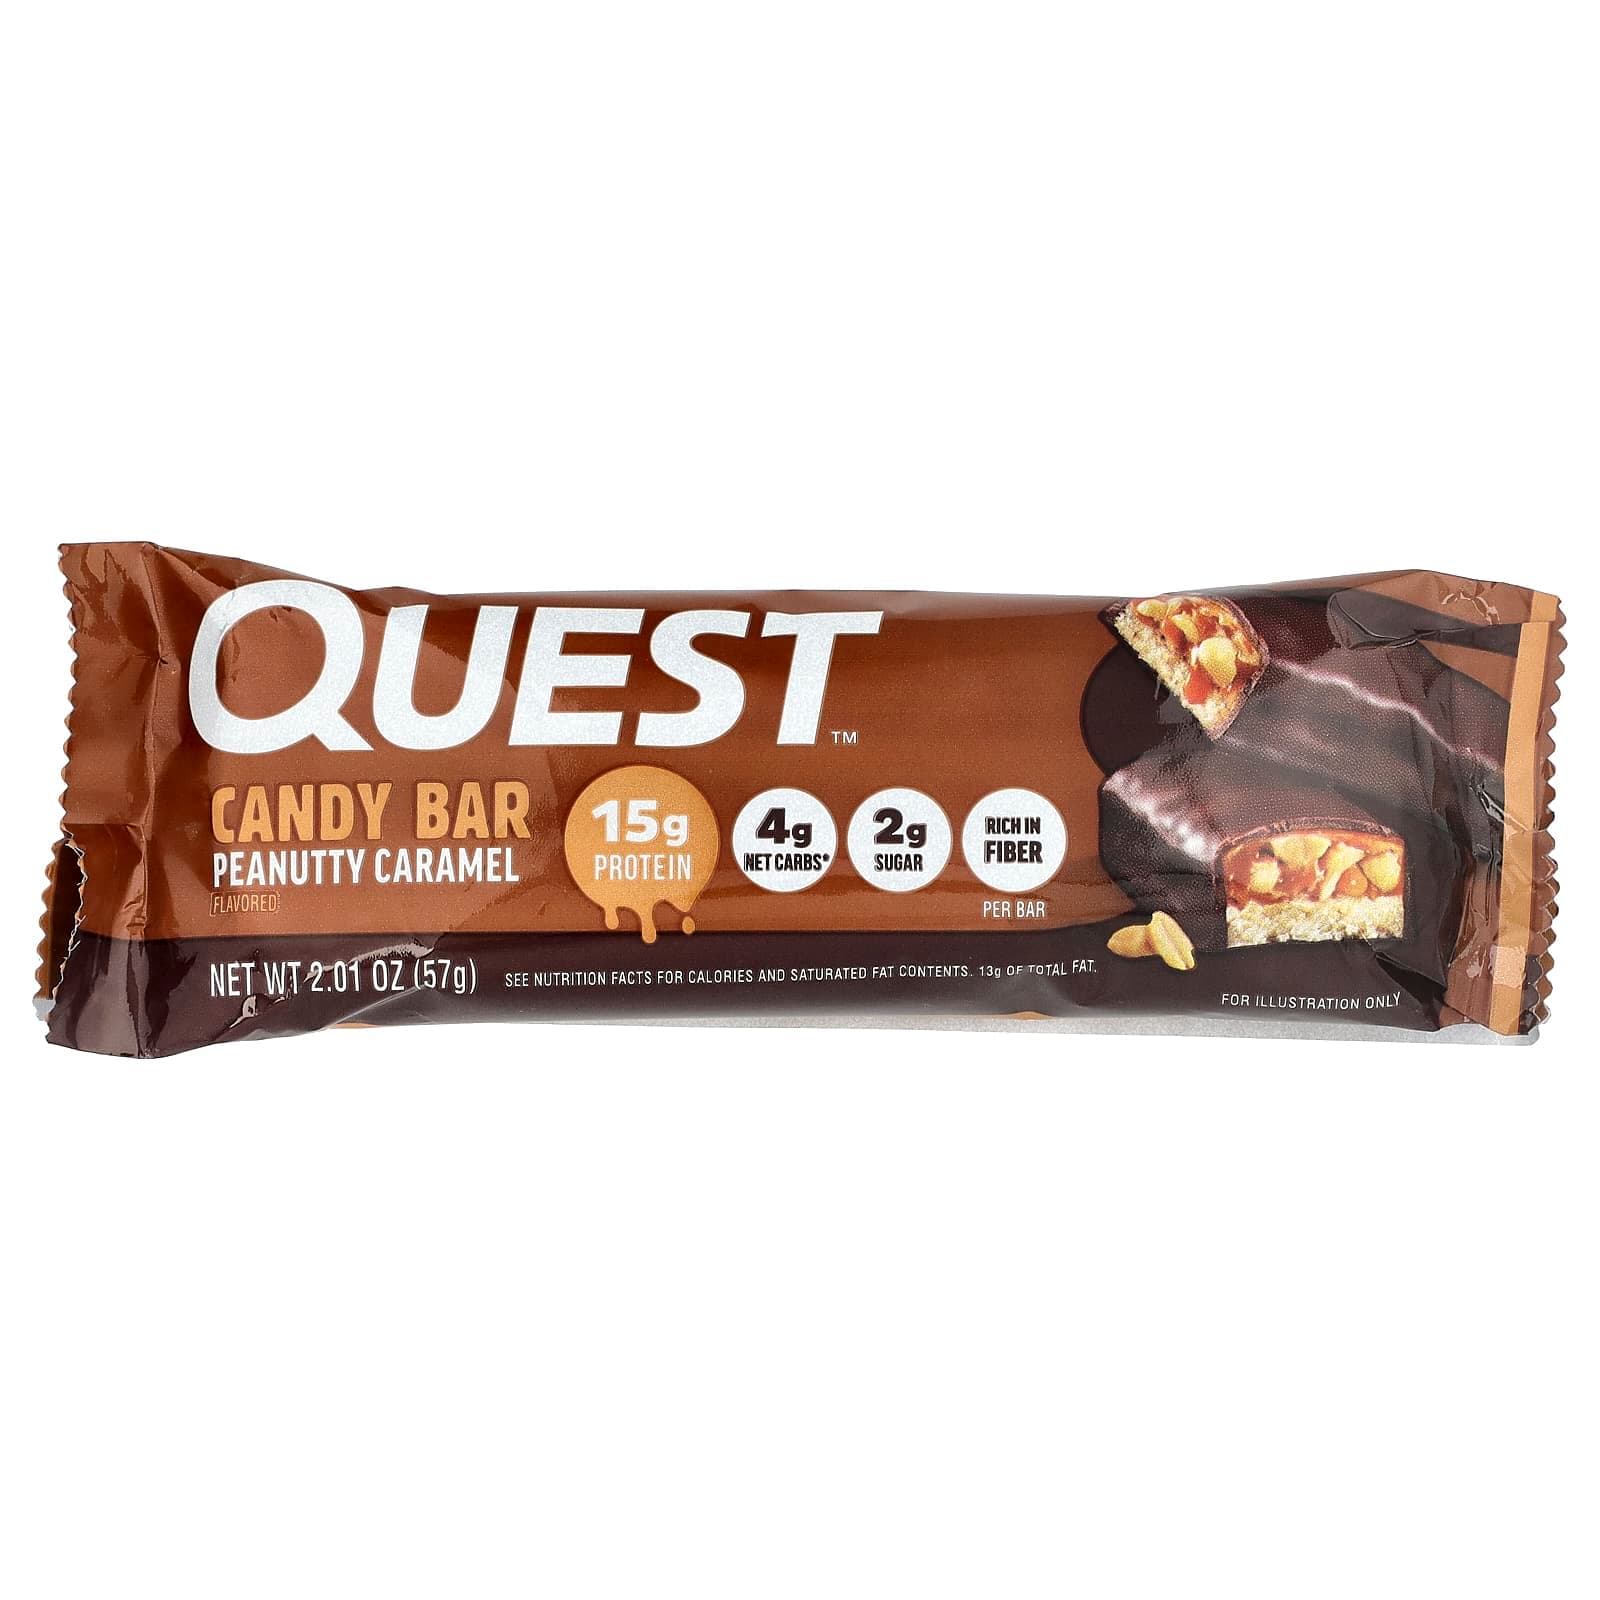 Quest Nutrition Quest Candy Bar, Peanutty Caramel | 46 | 7.1g | 22.8g | 22.8g | Buy | |
9 | 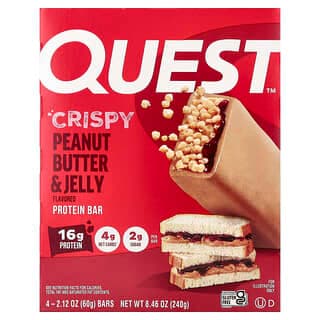 Quest Nutrition Quest Crispy Peanut Butter & Jelly Protein Bar | 41 | 7.6g | 21.7g | 11.7g | Buy |
The best non-classic bar is actually the Crispy Hero Cookies & Cream at rank #34 — still strong, but a noticeable step down from the classic top 20. From there, the drop accelerates. The Overload line (ranks #108–133) trades protein efficiency for indulgent textures — more fat, less protein per calorie, and prices around $3.60–$3.70 per bar compared to $2.61 for the classics. The remaining Hero Crispy bars (ranks #139–179) sacrifice protein density for a crunchier format, with some flavors dropping to just 25 g protein per 100 g. The Candy Bar (rank #208) leans heavily into fat at 22.81 g per 100 g, and the Crispy Peanut Butter & Jelly (rank #252) lands in the bottom half of all 414 bars.
If you're buying Quest for macros, stick to the classic line. The sub-lines are built for taste variety, not nutritional performance.
The bottom line
Quest's classic Protein Bar is one of the strongest product lines in our entire database. Thirteen of 15 flavors rank in the top 20 out of 414 bars — a consistency that no other brand in our catalogue matches at that scale. The fiber content alone sets the classic range apart from nearly every competitor, and the near-zero sugar across all flavors makes flavor choice almost irrelevant from a sugar perspective.
But step outside the classic line, and Quest's advantage fades. The Overload and Hero lines rank 100–200+ places lower and deliver less protein per calorie. The Quest name doesn't guarantee top-tier macros — only the classic bar does.
Here are a few common questions about the Quest bar range.