Here's a number most people don't expect: the average protein crisp in our catalogue delivers 51.3 g of protein per 100 g. The average protein bar? 29.4 g. That's nearly double the protein density — in a chip.
If you've been reaching for bars as your default high-protein snack, the data suggests you might be leaving protein on the table. For this piece we scored every protein crisp and protein bar in our catalogue across the same five dimensions — protein efficiency, leanness, low carb, fiber, and value — and the crisps came out ahead on both average protein density and average XRay Score.
This doesn't mean bars are bad. It means crisps are better than most people realize.
The numbers, head-to-head
Across our full catalogue:
Protein Crisps (20+ products at the time of writing): average protein per 100 g of 51.3 g, average XRay Score of 59.7. The top crisp — Quest Tortilla Style Chili Lime — scores 95.8 with 62.50 g protein per 100 g. It sits in the 100th percentile for both protein efficiency and leanness within its category.
Protein Bars (90+ products): average protein per 100 g of 29.4 g, average XRay Score of 52.1. The top bar — Quest Protein Bar S'Mores — scores 93.9 with 35.00 g protein per 100 g.
The top crisp beats the top bar. The average crisp beats the average bar. And the protein density gap — 51.3 vs 29.4 g per 100 g — is massive.
| Metric | 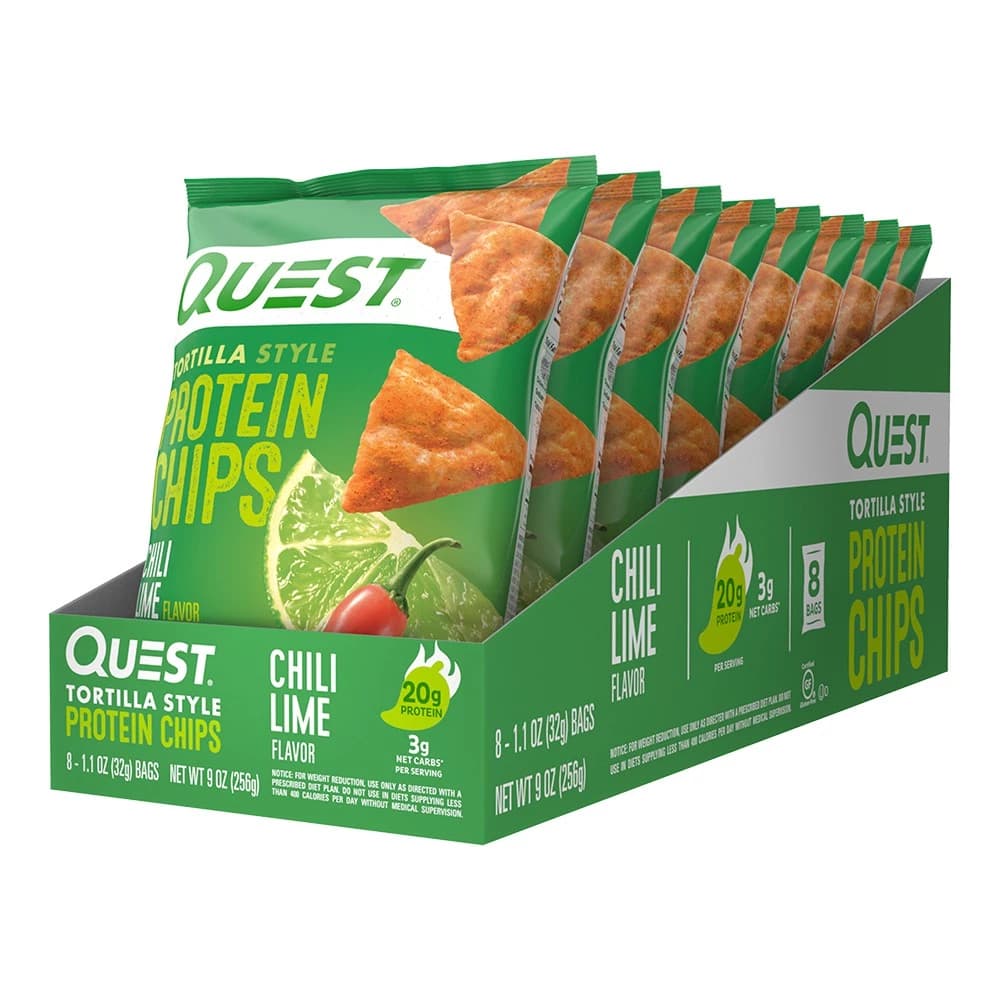 Side A Side A | 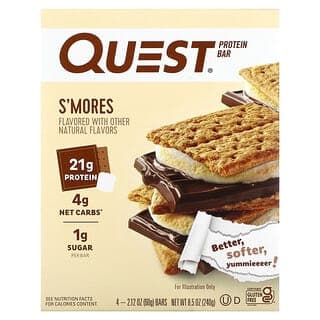 Side B Side B |
|---|---|---|
| Protein / 100 kcal | 14.3 g | 11.7 g |
| Protein / 100 g | 62.5 g | 35.0 g |
| Calories / 100 g | 437.5 kcal | 300.0 kcal |
| Fat / 100 g | 14.1 g | 11.7 g |
| Net carbs / 100 g | 9.4 g | 16.7 g |
| Fiber / 100 g | 3.1 g | 21.7 g |
| Sugar / 100 g | 0.0 g | 1.7 g |
Why crisps win on protein density
The reason is structural. A protein bar is a composite product — it needs a binding matrix (typically sugar alcohols, fiber syrups, or glycerin), a fat layer (often from coatings, nut butters, or chocolate), and moisture to hold everything together. All of that dilutes the protein concentration.
A protein crisp is essentially baked or extruded protein with seasoning. There's less structural filler to hold it together because the format doesn't require chewiness or layers. The result is a higher protein-to-everything-else ratio by weight.
Quest's tortilla-style chips deliver 59–62 g of protein per 100 g across most flavors. That's comparable to many protein powders — and you're eating them as a snack with salsa.
Where bars fight back: fiber
Bars have one major nutritional advantage that crisps can't match: fiber.
The top Quest bars deliver 20–25 g of fiber per 100 g, and Julian Bakery's Pea Protein Bar Dark Chocolate hits an extraordinary 31.67 g per 100 g — earning it a score of 90.4 (rank #3 among bars). Fiber is one of the five dimensions in our XRay Score, and it's the primary reason bars with moderate protein density still score in the high 80s and 90s.
Crisps, by contrast, typically carry just 3 g of fiber per 100 g. If your diet is already fiber-light and you're using snacks to fill that gap, bars are the better tool.
The top crisps you should know about
Quest dominates the crisp category — they hold 11 of the top 14 spots — but they're not the only brand worth knowing. Here's a mix of the top performers across brands:
| # | Product | XRay | P/100 kcal | kcal / 100 g | |
|---|---|---|---|---|---|
1 | Quest Nutrition Tortilla Style Protein Chips, Chili Lime | 90 | 14.3g | 437.5 | |
2 | 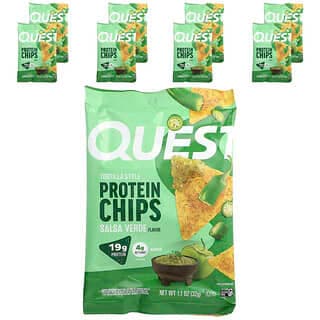 Quest Nutrition Tortilla Style Protein Chips, Salsa Verde | 86 | 13.6g | 437.5 | |
3 | 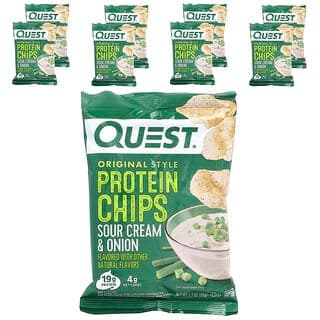 Quest Nutrition Original Style Protein Chips, Sour Cream & Onion | 84 | 13.6g | 437.5 | |
4 | 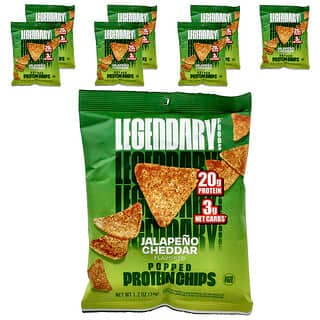 Legendary Foods Popped Protein Chips, Jalapeno Cheddar | 62 | 13.3g | 441.2 | |
5 | 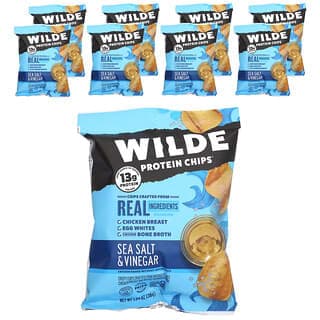 Wilde Brands Protein Chips®, Sea Salt & Vinegar | 34 | 6.2g | 552.6 | |
6 | 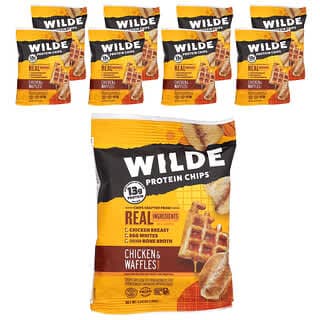 Wilde Brands Protein Chips®, Chicken & Waffles | 34 | 6.2g | 552.6 |
Quest Chili Lime leads the pack because it has the highest protein-to-calorie ratio: 14.29 g of protein per 100 kcal, with 62.50 g protein per 100 g vs the 59.38 g that most other flavors deliver. It also has slightly less fat (14.06 g vs 15.62 g per 100 g for most others), which pushes its leanness percentile to 100th.
Legendary Foods Popped Protein Chips (Jalapeno Cheddar, score 55.8) take a different approach — popped rather than baked — with 37.50 g protein per 100 g. Lower protein density than Quest, but a lighter texture some people prefer. Wilde Brands goes furthest off-script: their chips are made from real chicken breast, which gives them a completely different nutritional profile (more on that in our wildest flavors piece).
Beyond Quest: protein puffs and pretzels
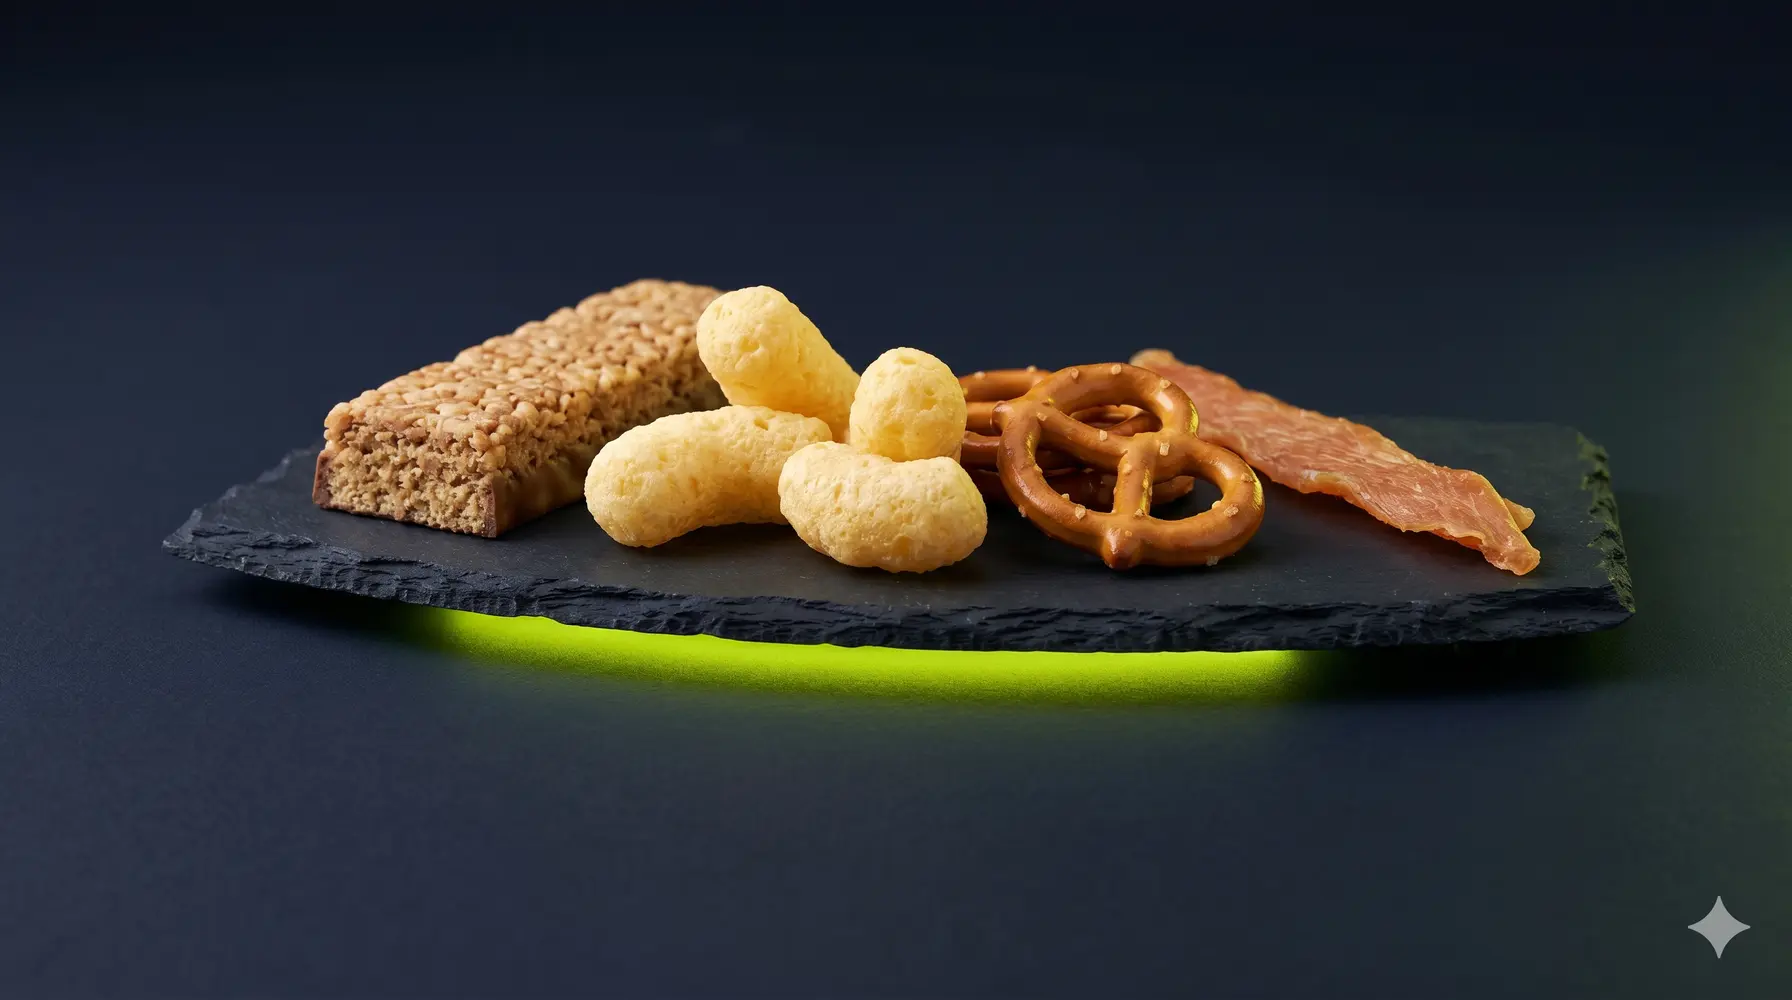
Crisps aren't the only high-protein snack format that outperforms bars. Two other products in our "Sweet Snack" category hit similar protein densities:
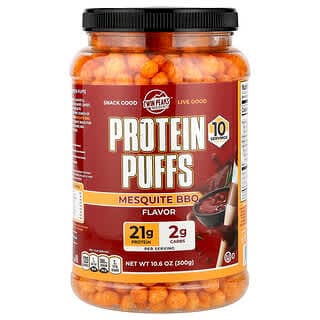
Twin Peaks Protein Puffs (Mesquite BBQ and Jalapeno Cheddar) deliver 70.00 g protein per 100 g — higher than any crisp — and score 85.2. The protein source is a milk blend, and they achieve their density through a puffed-extrusion process similar to cheese puffs.
Crisp Power Protein Pretzels (Sea Salt, Everything, Sesame) range from 52.91–56.44 g protein per 100 g with scores of 88.0–93.5. They're soy-based and pack a bonus: 21.16 g fiber per 100 g, bridging the gap that regular crisps leave open. For a deeper look at these formats, see our Beyond Bars piece.
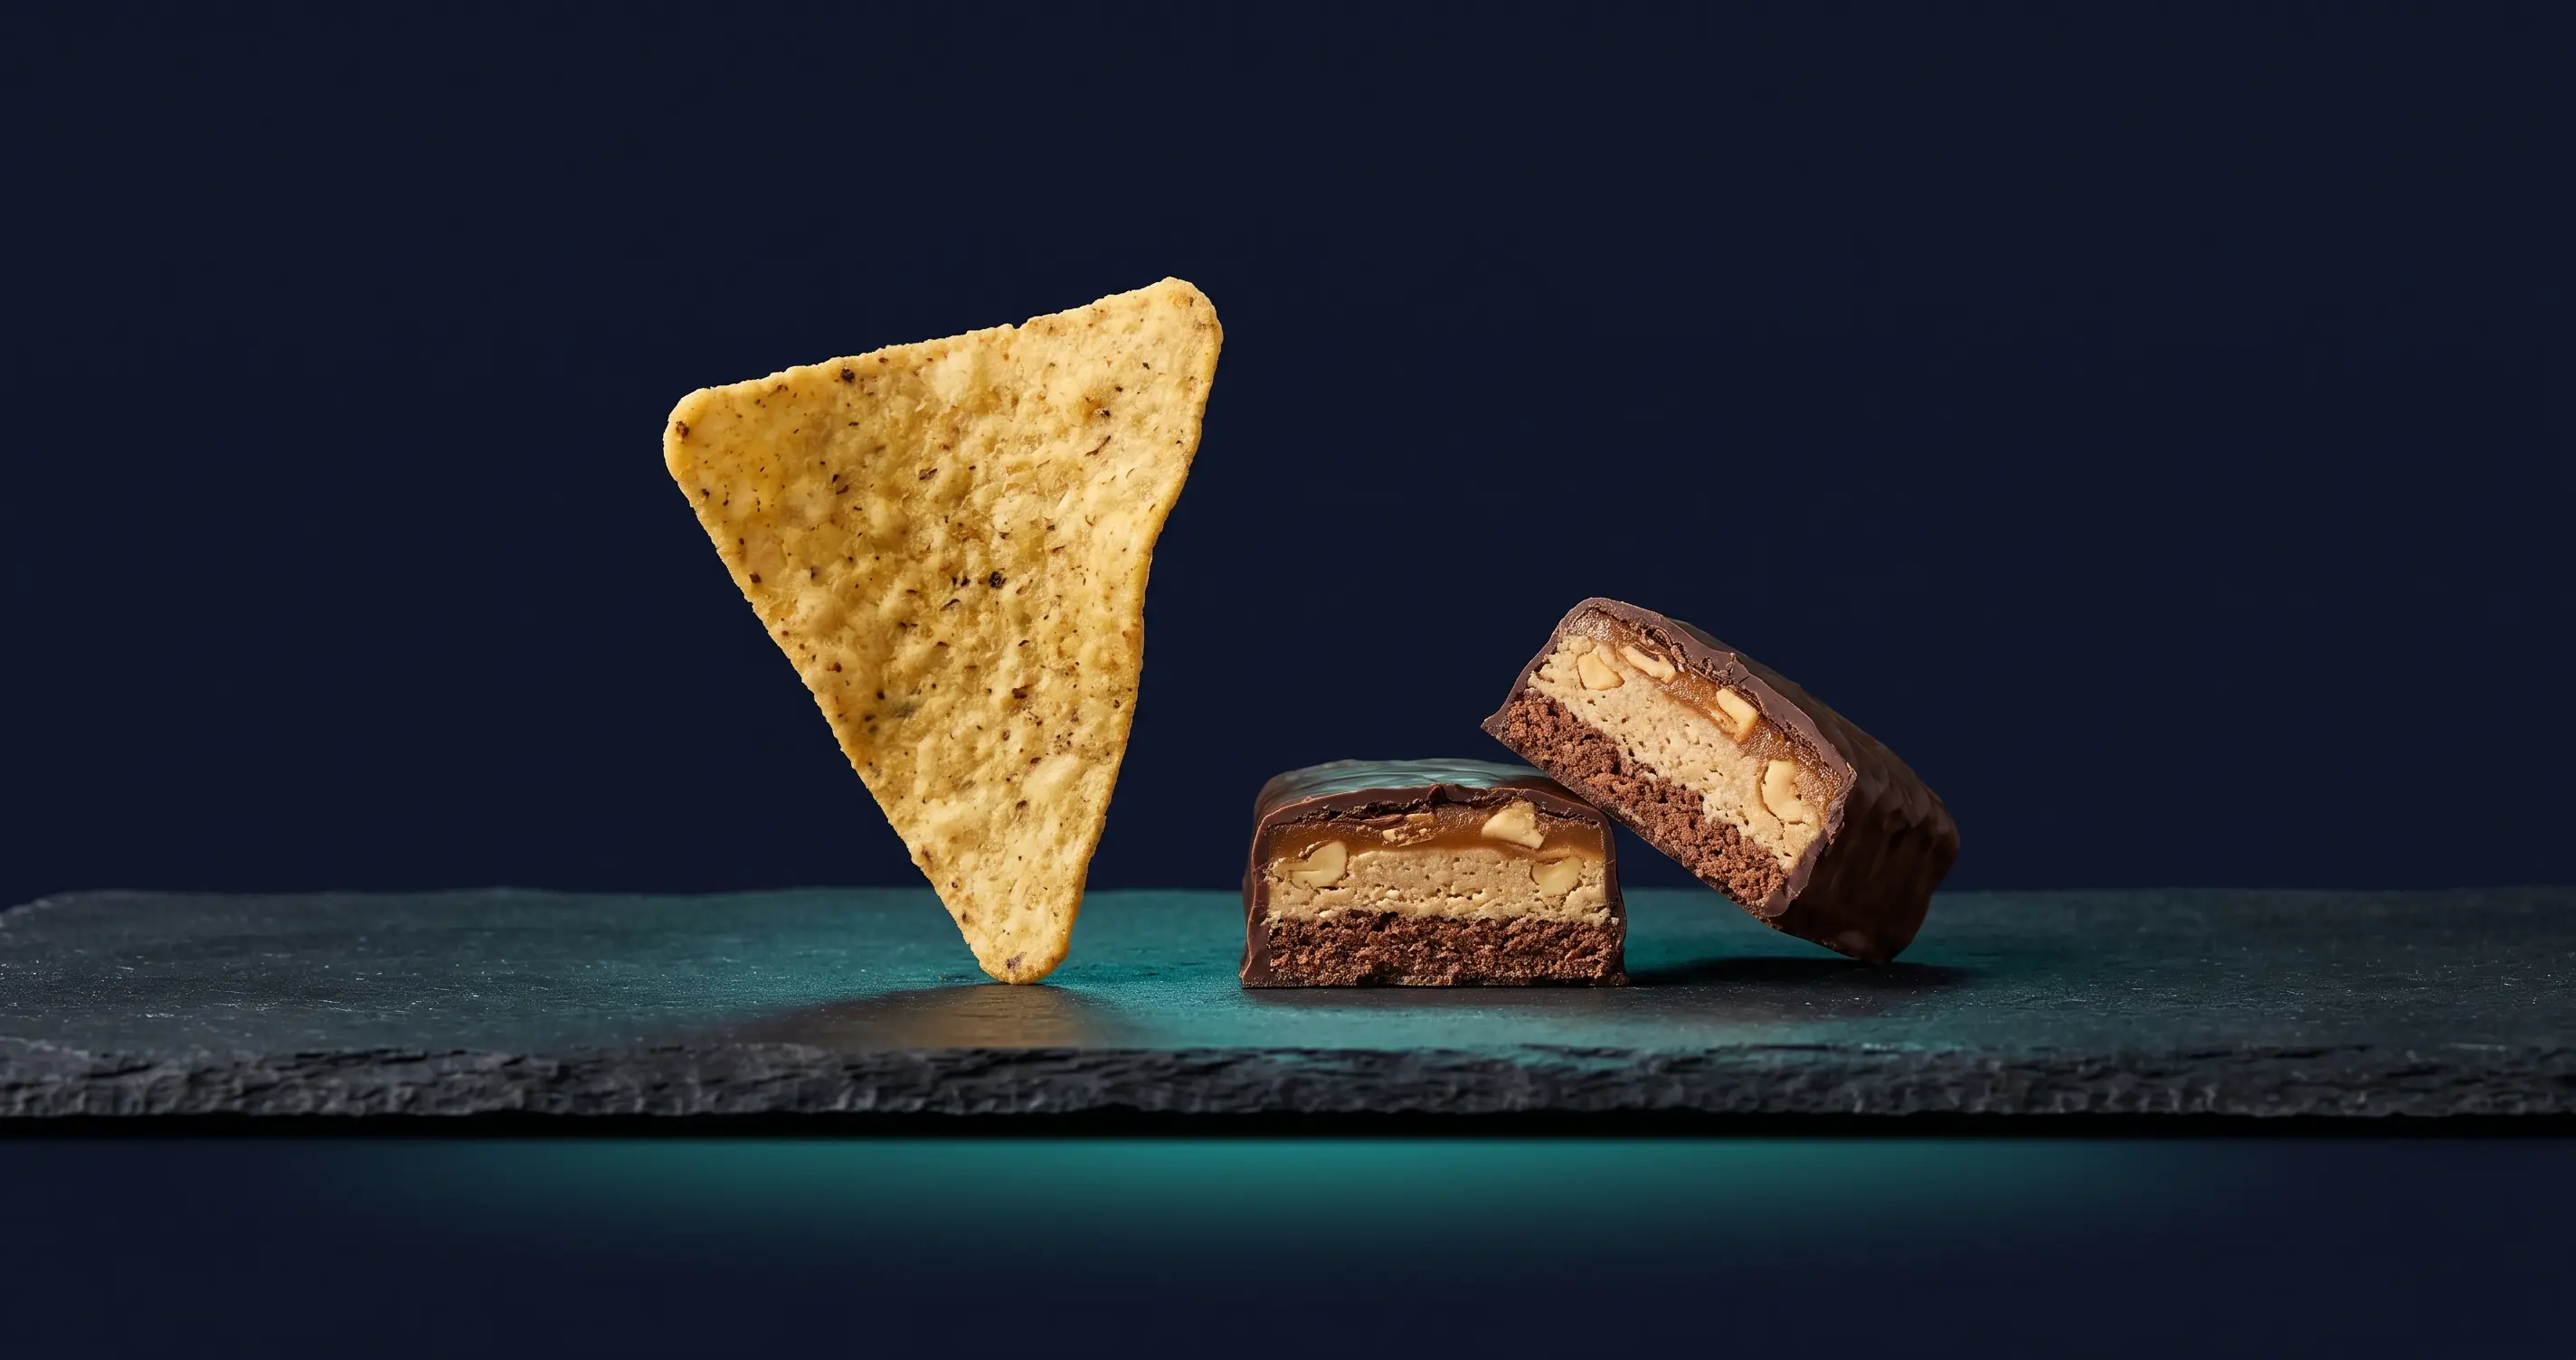
How to think about it
Bars and crisps serve different moments. A bar is a meal bridge — chewy, filling, portable in a bag. A crisp is an afternoon snack — satisfying, shareable, pairs with dips. The data doesn't say one replaces the other. It says both belong in the rotation — and if you've been ignoring the crisp aisle, the protein density gap is the reason to start.