"It's basically a candy bar with protein." You've heard it. Maybe you've said it. The claim usually comes with a vague gesture at sugar content and a knowing look — as if protein bars are a scam the fitness industry invented to sell chocolate in better packaging.
But is it true? We have a catalogue of over 200 protein bars, complete with per-100 g nutrition data, and a set of everyday food benchmarks built from USDA data. So instead of opinions, let's use numbers.
MacroXray may earn a commission on some links in this article at no extra cost to you. Full disclosure.
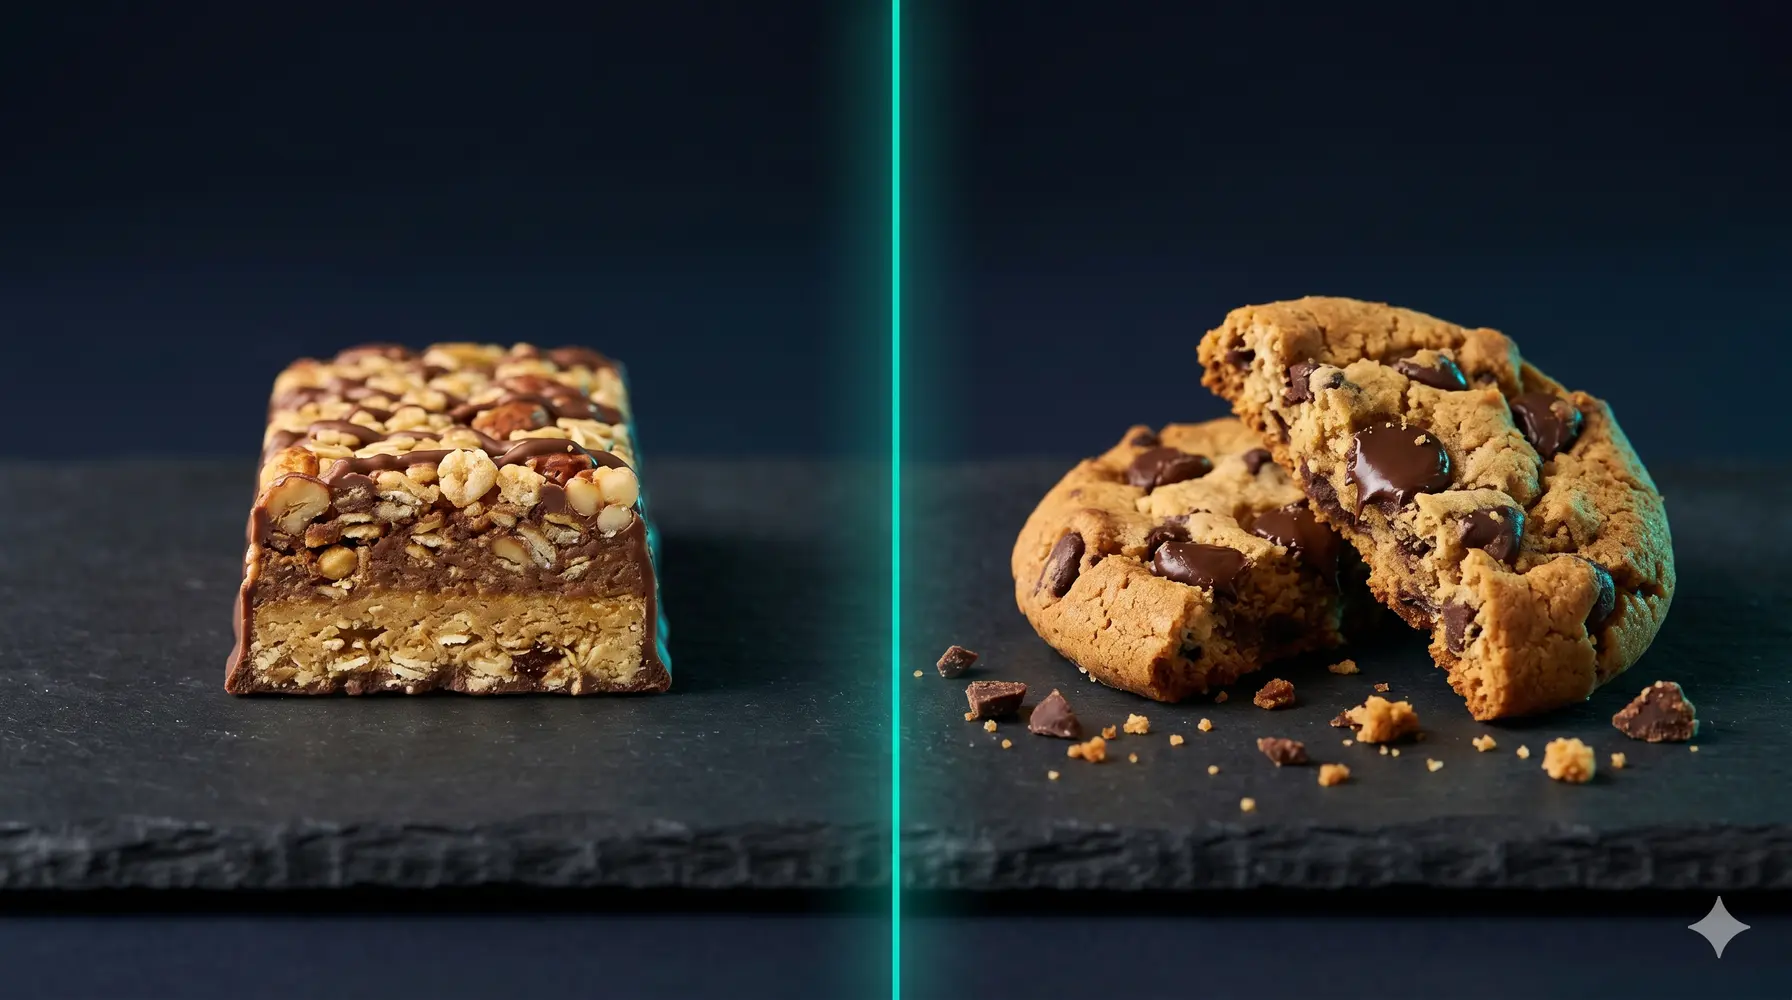
The head-to-head: protein bar vs cookie
Let's start with the most direct comparison — a top-ranked protein bar against a standard commercial chocolate chip cookie.
| Metric | 🍪 Chocolate chip cookie (commercial) | 🍩 Glazed donut | 🍦 Vanilla ice cream | |
|---|---|---|---|---|
| Protein / 100 kcal | 11.8 g | 1.1 g | 1.2 g | 1.7 g |
| Protein / 100 g | 33.3 g | 5.2 g | 5.0 g | 3.5 g |
| Calories / 100 g | 283.3 kcal | 488.0 kcal | 403.0 kcal | 207.0 kcal |
| Fat / 100 g | 10.0 g | 22.0 g | 23.0 g | 11.0 g |
| Fiber / 100 g | 25.0 g | 2.0 g | 1.2 g | 0.7 g |
| Sugar / 100 g | 1.7 g | 35.0 g | 18.0 g | 21.0 g |
The gap isn't subtle. Quest Chocolate Brownie delivers 33.33 g of protein per 100 g. A commercial chocolate chip cookie? 5.2 g. That's a 6× difference in protein density. The calorie picture is equally stark: the cookie packs 488 kcal per 100 g to the protein bar's 283 — meaning the cookie gives you almost double the calories for a fraction of the protein.
Sugar tells the most damning story. The cookie hits 35 g of sugar per 100 g. The Quest bar? 1.67 g. That's not a rounding error — it's a different category of food. And while the cookie contributes 2 g of fiber, the protein bar delivers 25 g.
The glazed donut falls somewhere in the middle: 403 kcal, 5 g protein, 18 g sugar per 100 g. Better than the cookie on sugar, worse on fat (23 g), and still nowhere close to a protein bar on protein content.
Not all protein bars are created equal
Here's where the "candy bar with protein" crowd has a point — sort of. The comparison above uses a top-ranked bar. A mid-range protein bar tells a different story.
| Metric | 🍪 Chocolate chip cookie (commercial) | 🍩 Glazed donut | |
|---|---|---|---|
| Protein / 100 kcal | 9.5 g | 1.1 g | 1.2 g |
| Protein / 100 g | 36.4 g | 5.2 g | 5.0 g |
| Calories / 100 g | 381.8 kcal | 488.0 kcal | 403.0 kcal |
| Fat / 100 g | 12.7 g | 22.0 g | 23.0 g |
| Fiber / 100 g | 3.6 g | 2.0 g | 1.2 g |
| Sugar / 100 g | 1.8 g | 35.0 g | 18.0 g |
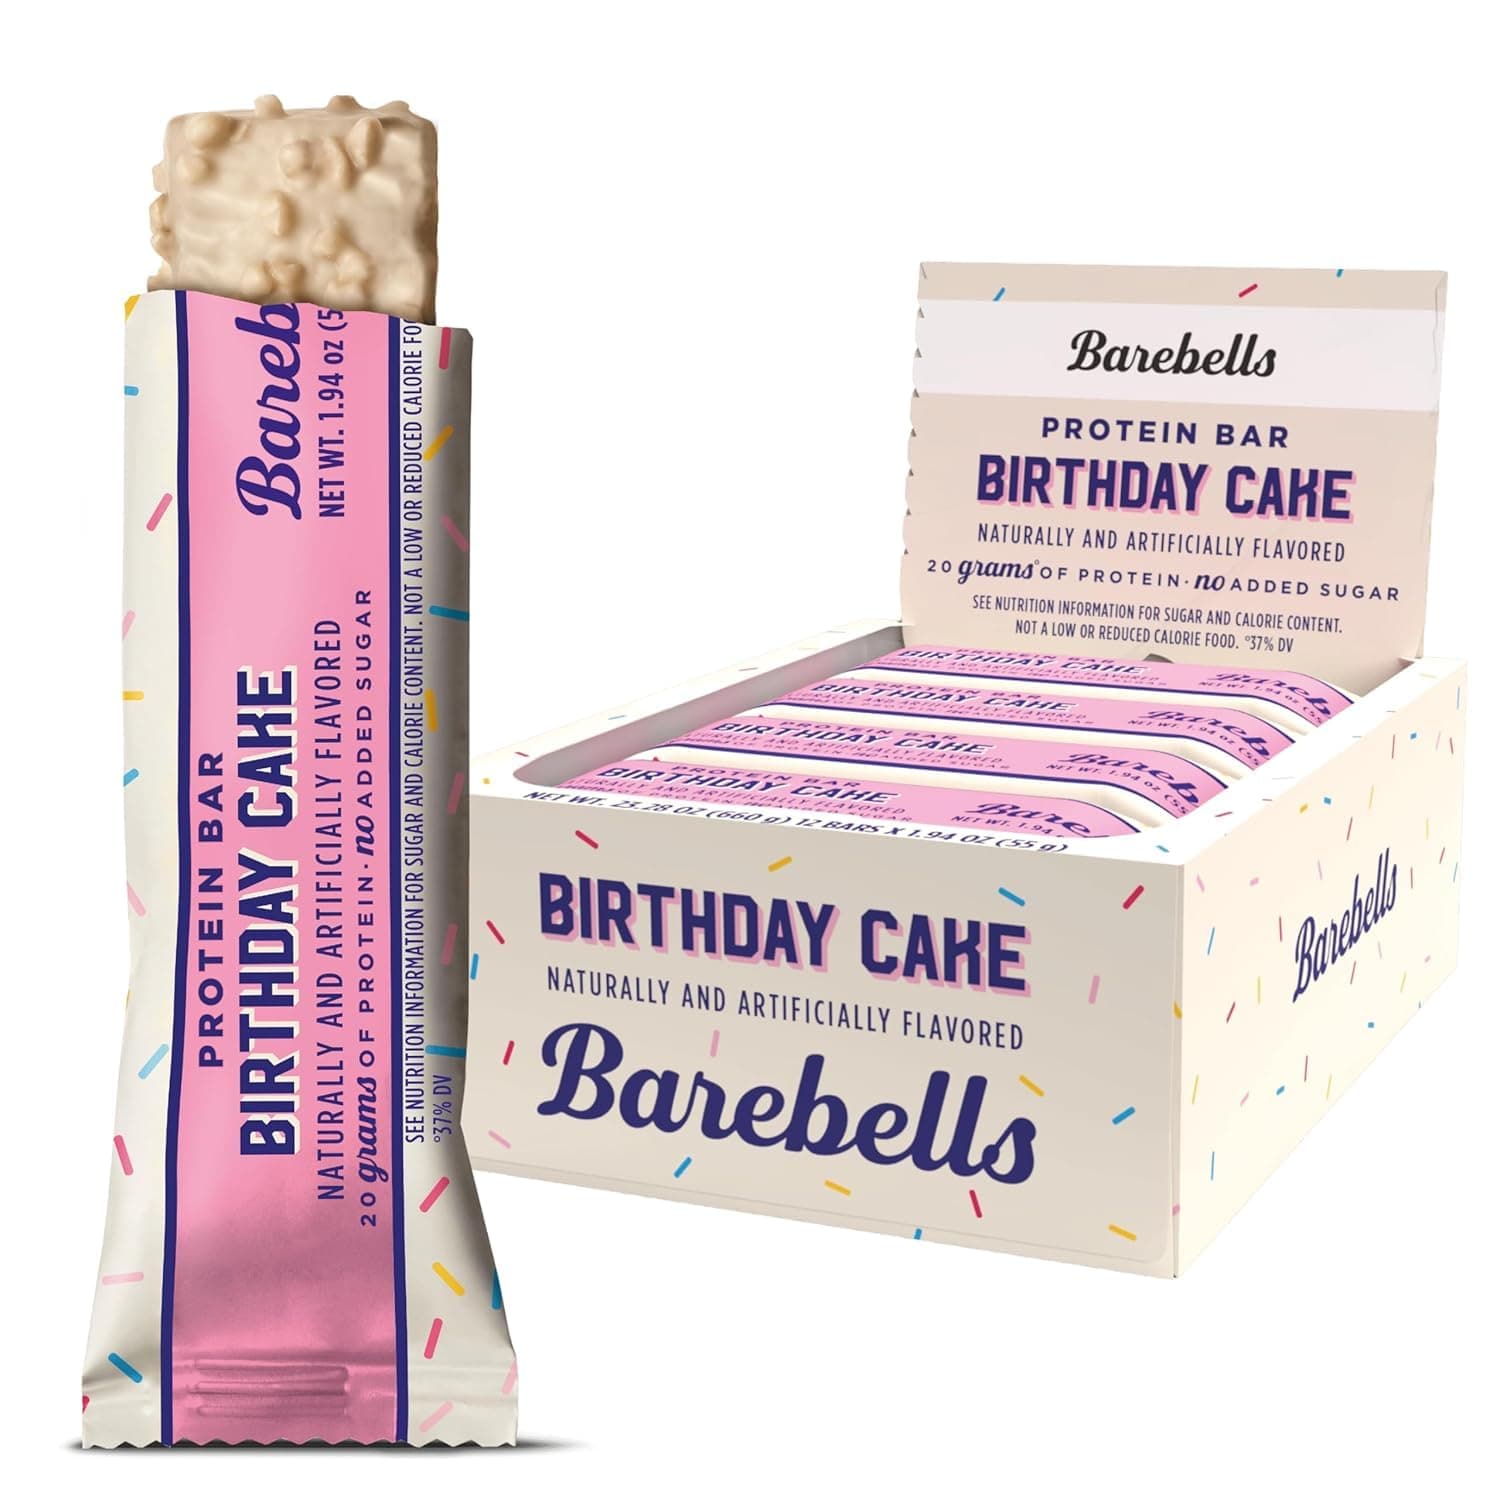
Barebells Birthday Cake sits at rank #66 with an XRay Score of 67.5. It delivers 36.36 g of protein per 100 g — still 7× more than a cookie — but the calorie count is higher at 381.82 kcal, and fat climbs to 12.73 g per 100 g. The sugar (1.82 g) stays remarkably low, but the overall macro profile is closer to the snack aisle than the top-tier Quest or Built bars.
This is why blanket statements about protein bars miss the point. The best protein bars are nutritionally in a different universe from candy. The worst protein bars can drift uncomfortably close — higher calories, higher fat, lower protein per calorie. The question isn't "are protein bars healthier than candy bars" — it's "is this specific protein bar healthier?" And answering that requires looking at the actual numbers.
The three metrics that separate protein bars from candy
After scoring over 200 bars, three metrics consistently separate genuine protein bars from sugar-with-marketing:
Protein per 100 kcal. This is the single best cutting metric. Top protein bars deliver 10–12 g of protein per 100 kcal. A glazed donut delivers about 1.2 g. A commercial cookie sits at roughly 1.1 g. If a "protein bar" can't clear 6 g per 100 kcal, it's a snack wearing gym clothes.
Sugar per 100 g. The best protein bars keep sugar under 5 g per 100 g — many are under 2 g. Candy bars sit at 25–50 g. This is the metric that reveals the difference most quickly on a nutrition label.
Fiber per 100 g. This one surprises people. Top protein bars carry 15–25 g of fiber per 100 g, which aids satiety and matters significantly for high-protein diets. Candy bars contribute almost zero. A bar with high fiber is working for you long after you've eaten it.
Every product page on MacroXray shows these metrics in a radar chart alongside percentile rankings — so you can see exactly where a bar sits relative to the entire category. No guesswork, no marketing claims, just the normalised numbers.
How to find the right bar for you
The protein bar market has over 200 products in our catalogue alone, and more arrive every month. Narrowing that down depends on what you're optimising for — and that's exactly what MacroXray is built to help with.
If you know what you want, the product catalogue lets you filter by product form, dietary needs, and sort by any dimension — protein efficiency, leanness, value, or overall XRay Score. Every product page breaks down the full nutrition profile, shows where the product ranks in its category, and compares prices across retailers so you can find the best deal.
If you're craving something specific, Crave mode lets you build a sentence: "I want a bar that tastes like chocolate, under 200 kcal, with at least 20 g protein." It filters the catalogue to exactly what fits and ranks the results.
If you want to optimise for a goal, Optimize has pre-built modes — Cutting, Bulking, Fiber Chasing — that surface the top products for each objective. We ranked the 7 best bars for cutting using this data, and the results aren't what most listicles would suggest.
If you find a product you already buy, Benchmark lets you enter its macros and see how it stacks up against the category. The radar chart shows your product's strengths and blind spots instantly — including how it compares to the everyday foods in this article.
And once you find products you like, you can save them to personal lists, rate and review them, and share your lists publicly. The community ratings include quick word chips — "Tasty," "Chalky," "Sweet," "Filling" — so you're not just getting macro data, you're getting real feedback from people who've actually tasted the product.
The #3 ranked bar overall — 6× more protein than a cookie, at lower calories.
The bottom line
Are protein bars healthier than candy bars? The best ones, categorically yes — and it's not close. A top-tier protein bar delivers 6–7× more protein, a fraction of the sugar, and meaningful fiber, all at lower calories per 100 g. But the worst protein bars narrow that gap significantly, which is why looking at the actual numbers matters more than reading the front of the package.
The real answer to "is this protein bar worth it?" is always in the data. That's why we built MacroXray — to make that data accessible for every product, not just the ones with the biggest marketing budgets.