If you've spent any time browsing protein powders, two names come up constantly: Dymatize ISO100 and Optimum Nutrition Gold Standard. Both are whey-based, both dominate shelf space, both have loyal followings. But they're built around different philosophies — and the nutritional data tells a clearer story than any marketing page.
We ran both product lines through MacroXray's scoring system. The result wasn't a clean sweep for either brand. ISO100 dominates the top of the rankings on raw protein efficiency. Gold Standard counters with a broader range and some surprisingly strong isolate variants. Which one is right for you depends on what you're optimizing for.
MacroXray may earn a commission on some links in this article at no extra cost to you. Full disclosure.
The headline numbers
Dymatize ISO100 Gourmet Vanilla (5 lb) sits at #1 in our protein powder rankings with an XRay Score of 90.5. It delivers 83.33 g of protein per 100 g of powder at 366.67 kcal — that's 22.73 g of protein per 100 kcal. Zero fat. For anyone tracking macros closely, that's about as clean as a powder gets.
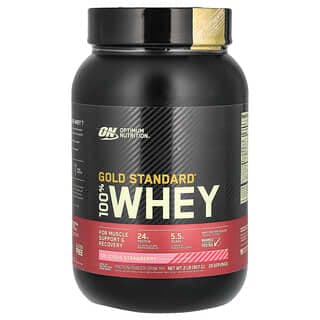
Optimum Nutrition Gold Standard Whey Delicious Strawberry (5 lb) ranks #34 with a score of 73.2. It delivers 77.42 g of protein per 100 g at 387.10 kcal — that's 20.00 g of protein per 100 kcal, with 4.84 g fat per 100 g.
The gap in protein efficiency is real but narrower than you'd expect: 22.73 vs 20.00 g per 100 kcal. ISO100 wins — but Gold Standard isn't far off, and it brings other strengths.
| Metric |  Side A Side A | Side B |
|---|---|---|
| Protein / 100 kcal | 22.7 g | 20.0 g |
| Protein / 100 g | 83.3 g | 77.4 g |
| Calories / 100 g | 366.7 kcal | 387.1 kcal |
| Fat / 100 g | 3.3 g | 4.8 g |
| Net carbs / 100 g | 6.7 g | 9.7 g |
| Fiber / 100 g | 0.0 g | 0.0 g |
| Sugar / 100 g | 3.3 g | 6.5 g |
Where ISO100 pulls ahead
ISO100's advantage is concentration. Across its lineup, the best variants hit 83.33 g protein per 100 g with zero fat — among the highest ratios in any protein powder. Both rank #1 products in our powder rankings are ISO100 variants (Gourmet Vanilla and Fruity Pebbles, tied at 90.5), and multiple flavors cluster in the top 20.
That protein density translates directly to calorie efficiency. If you're cutting and every calorie counts, ISO100 lets you hit your protein target with fewer total calories than almost any competitor. Its best variants land in the 98th percentile for protein efficiency across 129 ranked protein powders.
The other dimension where ISO100 quietly excels is leanness. Several variants show 0 g fat per 100 g on their label — the closest you'll find to pure protein in powder form.
Where Gold Standard fights back
ON's counter-argument starts with one product line most people overlook: Gold Standard Isolate.
ON offers two relevant tiers: Gold Standard Whey (the mainstream option) and Gold Standard Isolate (their premium tier). Most buyers default to the Whey line — but the Isolate line is where things get interesting.
Gold Standard Isolate Chocolate Bliss scores 86.7 (rank #3) with 80.65 g protein per 100 g and just 1.61 g fat — landing in the 99th percentile for both protein efficiency and leanness. Rich Vanilla scores 86.4 (rank #4) with 83.33 g protein per 100 g and zero fat, hitting the 100th percentile for protein efficiency — literally the top of the entire catalogue.
In raw protein-per-calorie terms, Gold Standard Isolate Rich Vanilla delivers 24.99 g of protein per 100 kcal — actually surpassing ISO100's 22.73.
The closer comparison: ISO100 vs Gold Standard Isolate
The real matchup isn't ISO100 vs Gold Standard Whey — those target different needs. The fair fight is ISO100 vs Gold Standard Isolate, both premium products going after the same buyer.
| Metric |  Side A Side A | Side B |
|---|---|---|
| Protein / 100 kcal | 20.8 g | 22.7 g |
| Protein / 100 g | 78.1 g | 80.7 g |
| Calories / 100 g | 375.0 kcal | 354.8 kcal |
| Fat / 100 g | 3.1 g | 1.6 g |
| Net carbs / 100 g | 6.3 g | — |
| Fiber / 100 g | 0.0 g | — |
| Sugar / 100 g | 3.1 g | — |
At comparable tub sizes (~3 lb), ON Gold Standard Isolate Chocolate Bliss actually scores higher than ISO100 Gourmet Chocolate (86.7 vs 81.5). The difference comes from a leaner nutritional profile: 1.61 g fat per 100 g vs 3.12 g, and 354.84 kcal per 100 g vs 375.00. Fewer calories for a similar protein hit.
Both products deliver excellent protein per 100 g (80.65 vs 78.12). Both are gluten-free, dairy-based, and whey isolate.
So which one should you pick?
There's no universal winner — it depends on what you're optimizing for.
| # | Product | XRay | P/100 kcal | kcal / 100 g | Buy | |
|---|---|---|---|---|---|---|
1 | 85 | 22.7g | 366.7 | Buy | ||
2 | 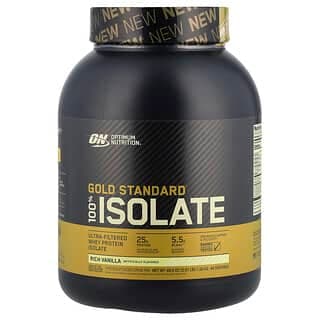 Optimum Nutrition Gold Standard® 100% Isolate, Rich Vanilla | 70 | 25.0g | 333.3 | Buy | |
3 | Optimum Nutrition Gold Standard® 100% Isolate, Chocolate Bliss | 73 | 22.7g | 354.8 | Buy | |
4 | 78 | 20.8g | 400.0 | Buy | ||
5 | Optimum Nutrition Gold Standard® 100% Whey, Delicious Strawberry | 66 | 20.0g | 387.1 | Buy |